Menominee vs Cypriot Median Female Earnings
COMPARE
Menominee
Cypriot
Median Female Earnings
Median Female Earnings Comparison
Menominee
Cypriots
$33,894
MEDIAN FEMALE EARNINGS
0.0/ 100
METRIC RATING
330th/ 347
METRIC RANK
$45,570
MEDIAN FEMALE EARNINGS
100.0/ 100
METRIC RATING
18th/ 347
METRIC RANK
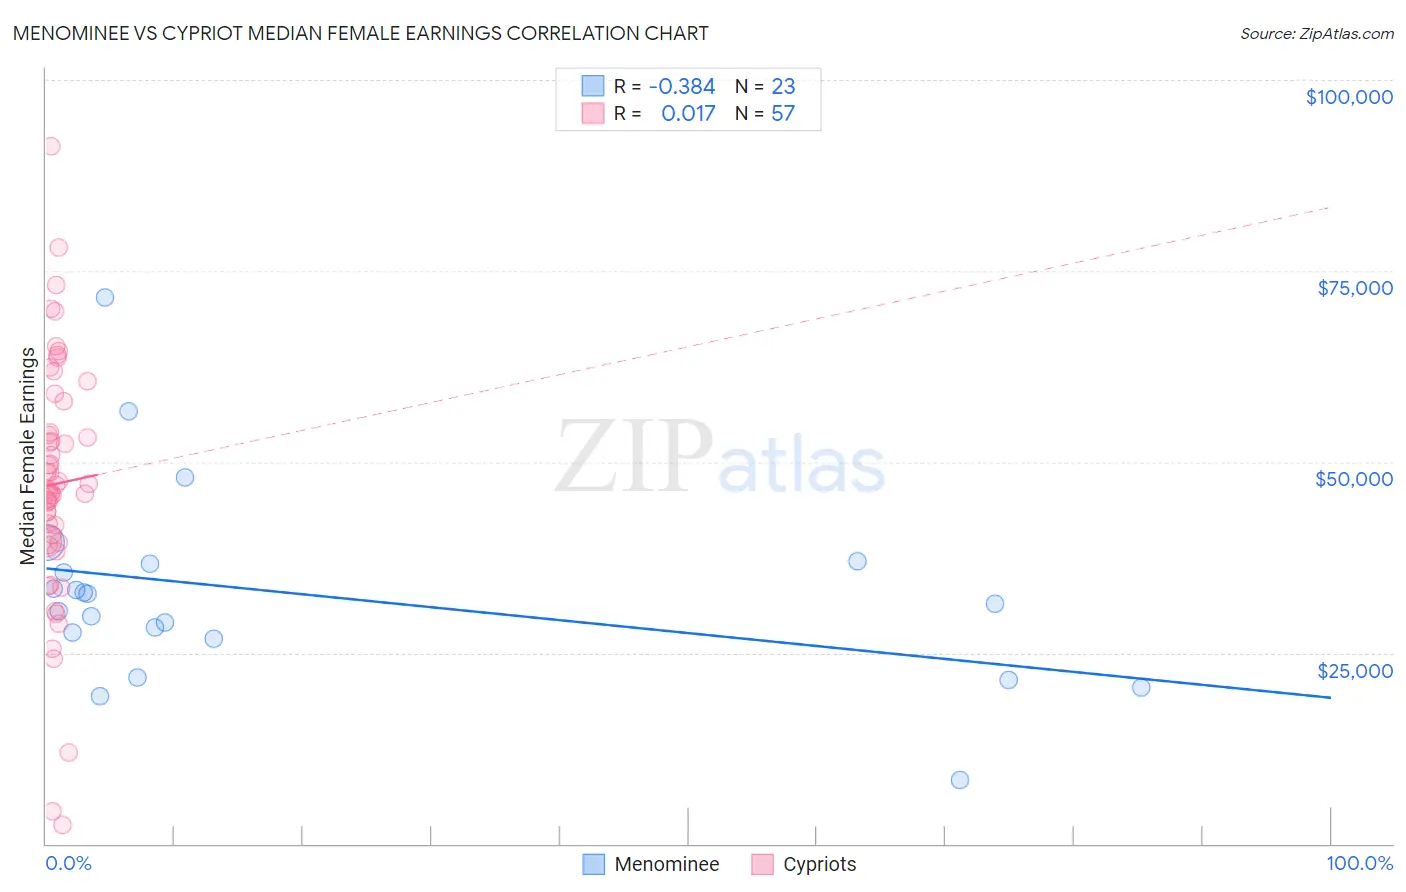
Menominee vs Cypriot Median Female Earnings Correlation Chart
The statistical analysis conducted on geographies consisting of 45,775,261 people shows a mild negative correlation between the proportion of Menominee and median female earnings in the United States with a correlation coefficient (R) of -0.384 and weighted average of $33,894. Similarly, the statistical analysis conducted on geographies consisting of 61,860,618 people shows no correlation between the proportion of Cypriots and median female earnings in the United States with a correlation coefficient (R) of 0.017 and weighted average of $45,570, a difference of 34.4%.
Median Female Earnings Correlation Summary
| Measurement | Menominee | Cypriot |
| Minimum | $8,333 | $2,499 |
| Maximum | $71,591 | $91,382 |
| Range | $63,258 | $88,883 |
| Mean | $32,691 | $47,121 |
| Median | $31,453 | $46,430 |
| Interquartile 25% (IQ1) | $26,780 | $39,556 |
| Interquartile 75% (IQ3) | $36,632 | $55,932 |
| Interquartile Range (IQR) | $9,852 | $16,376 |
| Standard Deviation (Sample) | $12,945 | $16,285 |
| Standard Deviation (Population) | $12,660 | $16,141 |
Similar Demographics by Median Female Earnings
Demographics Similar to Menominee by Median Female Earnings
In terms of median female earnings, the demographic groups most similar to Menominee are Hopi ($33,932, a difference of 0.11%), Immigrants from Central America ($33,953, a difference of 0.17%), Native/Alaskan ($33,806, a difference of 0.26%), Choctaw ($33,775, a difference of 0.35%), and Cajun ($34,034, a difference of 0.41%).
| Demographics | Rating | Rank | Median Female Earnings |
| Seminole | 0.0 /100 | #323 | Tragic $34,385 |
| Immigrants | Congo | 0.0 /100 | #324 | Tragic $34,317 |
| Dutch West Indians | 0.0 /100 | #325 | Tragic $34,106 |
| Kiowa | 0.0 /100 | #326 | Tragic $34,074 |
| Cajuns | 0.0 /100 | #327 | Tragic $34,034 |
| Immigrants | Central America | 0.0 /100 | #328 | Tragic $33,953 |
| Hopi | 0.0 /100 | #329 | Tragic $33,932 |
| Menominee | 0.0 /100 | #330 | Tragic $33,894 |
| Natives/Alaskans | 0.0 /100 | #331 | Tragic $33,806 |
| Choctaw | 0.0 /100 | #332 | Tragic $33,775 |
| Mexicans | 0.0 /100 | #333 | Tragic $33,664 |
| Spanish American Indians | 0.0 /100 | #334 | Tragic $33,625 |
| Creek | 0.0 /100 | #335 | Tragic $33,437 |
| Ottawa | 0.0 /100 | #336 | Tragic $33,378 |
| Yakama | 0.0 /100 | #337 | Tragic $33,354 |
Demographics Similar to Cypriots by Median Female Earnings
In terms of median female earnings, the demographic groups most similar to Cypriots are Eastern European ($45,385, a difference of 0.41%), Immigrants from Japan ($45,323, a difference of 0.55%), Cambodian ($45,014, a difference of 1.2%), Immigrants from Greece ($44,976, a difference of 1.3%), and Burmese ($44,911, a difference of 1.5%).
| Demographics | Rating | Rank | Median Female Earnings |
| Okinawans | 100.0 /100 | #11 | Exceptional $46,905 |
| Immigrants | Israel | 100.0 /100 | #12 | Exceptional $46,902 |
| Immigrants | Australia | 100.0 /100 | #13 | Exceptional $46,573 |
| Soviet Union | 100.0 /100 | #14 | Exceptional $46,556 |
| Immigrants | Eastern Asia | 100.0 /100 | #15 | Exceptional $46,502 |
| Indians (Asian) | 100.0 /100 | #16 | Exceptional $46,481 |
| Immigrants | South Central Asia | 100.0 /100 | #17 | Exceptional $46,324 |
| Cypriots | 100.0 /100 | #18 | Exceptional $45,570 |
| Eastern Europeans | 100.0 /100 | #19 | Exceptional $45,385 |
| Immigrants | Japan | 100.0 /100 | #20 | Exceptional $45,323 |
| Cambodians | 100.0 /100 | #21 | Exceptional $45,014 |
| Immigrants | Greece | 100.0 /100 | #22 | Exceptional $44,976 |
| Burmese | 100.0 /100 | #23 | Exceptional $44,911 |
| Immigrants | Korea | 100.0 /100 | #24 | Exceptional $44,847 |
| Immigrants | Sweden | 100.0 /100 | #25 | Exceptional $44,774 |