Chippewa vs Immigrants from Russia Median Female Earnings
COMPARE
Chippewa
Immigrants from Russia
Median Female Earnings
Median Female Earnings Comparison
Chippewa
Immigrants from Russia
$35,003
MEDIAN FEMALE EARNINGS
0.0/ 100
METRIC RATING
310th/ 347
METRIC RANK
$44,680
MEDIAN FEMALE EARNINGS
100.0/ 100
METRIC RATING
28th/ 347
METRIC RANK
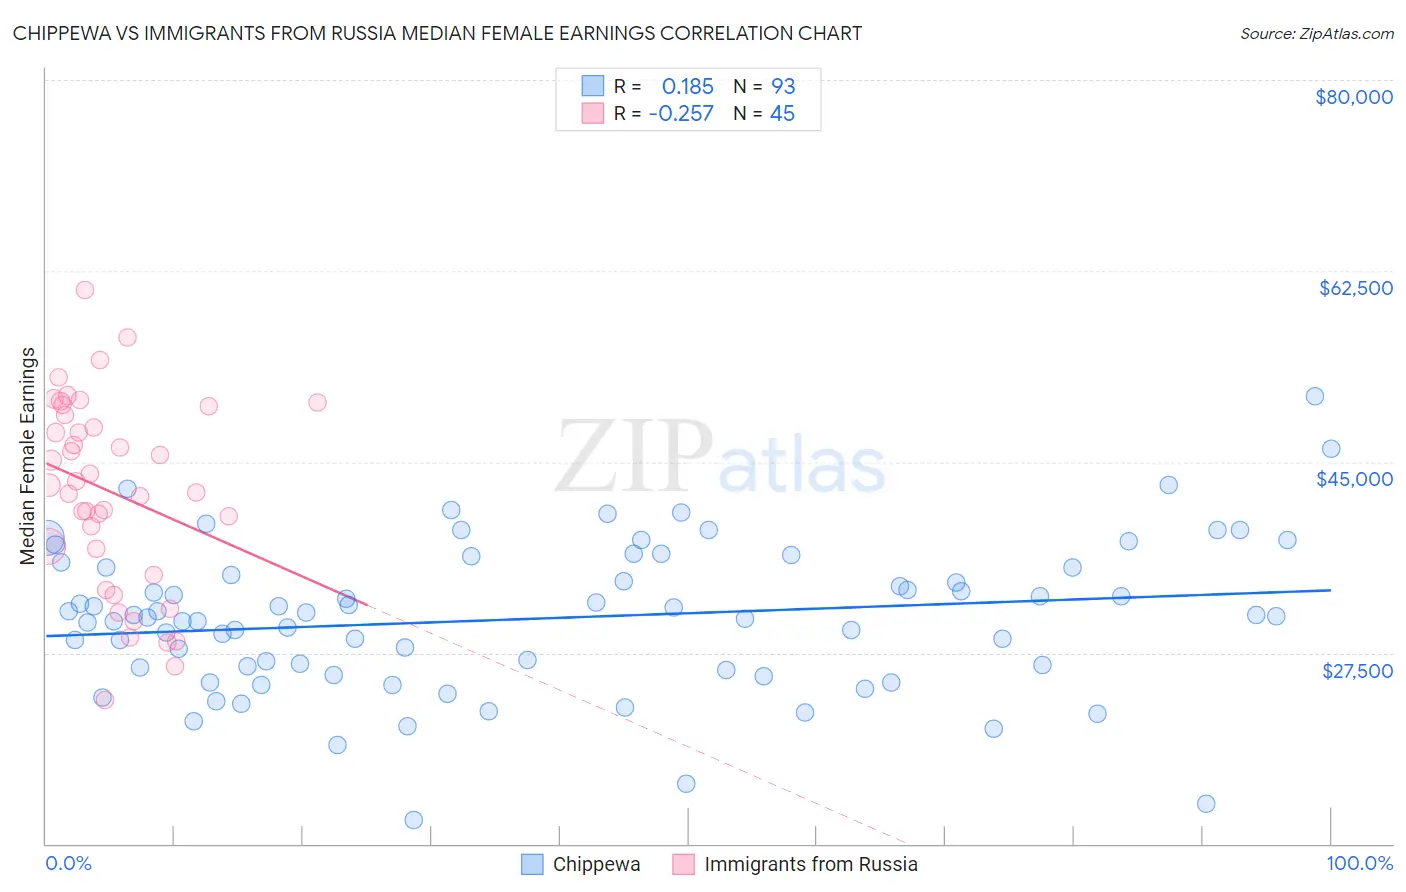
Chippewa vs Immigrants from Russia Median Female Earnings Correlation Chart
The statistical analysis conducted on geographies consisting of 214,968,178 people shows a poor positive correlation between the proportion of Chippewa and median female earnings in the United States with a correlation coefficient (R) of 0.185 and weighted average of $35,003. Similarly, the statistical analysis conducted on geographies consisting of 347,839,336 people shows a weak negative correlation between the proportion of Immigrants from Russia and median female earnings in the United States with a correlation coefficient (R) of -0.257 and weighted average of $44,680, a difference of 27.6%.
Median Female Earnings Correlation Summary
| Measurement | Chippewa | Immigrants from Russia |
| Minimum | $12,188 | $23,199 |
| Maximum | $50,958 | $60,754 |
| Range | $38,770 | $37,555 |
| Mean | $30,628 | $42,242 |
| Median | $30,893 | $42,848 |
| Interquartile 25% (IQ1) | $26,067 | $35,838 |
| Interquartile 75% (IQ3) | $35,324 | $49,732 |
| Interquartile Range (IQR) | $9,258 | $13,894 |
| Standard Deviation (Sample) | $6,851 | $8,738 |
| Standard Deviation (Population) | $6,814 | $8,640 |
Similar Demographics by Median Female Earnings
Demographics Similar to Chippewa by Median Female Earnings
In terms of median female earnings, the demographic groups most similar to Chippewa are Honduran ($35,013, a difference of 0.030%), Immigrants from Bahamas ($35,027, a difference of 0.070%), Ute ($34,960, a difference of 0.12%), Sioux ($35,063, a difference of 0.17%), and Yaqui ($34,943, a difference of 0.17%).
| Demographics | Rating | Rank | Median Female Earnings |
| Immigrants | Latin America | 0.0 /100 | #303 | Tragic $35,307 |
| Crow | 0.0 /100 | #304 | Tragic $35,266 |
| Bahamians | 0.0 /100 | #305 | Tragic $35,125 |
| Fijians | 0.0 /100 | #306 | Tragic $35,114 |
| Sioux | 0.0 /100 | #307 | Tragic $35,063 |
| Immigrants | Bahamas | 0.0 /100 | #308 | Tragic $35,027 |
| Hondurans | 0.0 /100 | #309 | Tragic $35,013 |
| Chippewa | 0.0 /100 | #310 | Tragic $35,003 |
| Ute | 0.0 /100 | #311 | Tragic $34,960 |
| Yaqui | 0.0 /100 | #312 | Tragic $34,943 |
| Cubans | 0.0 /100 | #313 | Tragic $34,942 |
| Apache | 0.0 /100 | #314 | Tragic $34,895 |
| Pennsylvania Germans | 0.0 /100 | #315 | Tragic $34,802 |
| Cherokee | 0.0 /100 | #316 | Tragic $34,742 |
| Potawatomi | 0.0 /100 | #317 | Tragic $34,739 |
Demographics Similar to Immigrants from Russia by Median Female Earnings
In terms of median female earnings, the demographic groups most similar to Immigrants from Russia are Turkish ($44,695, a difference of 0.030%), Immigrants from Belarus ($44,757, a difference of 0.17%), Immigrants from Sweden ($44,774, a difference of 0.21%), Immigrants from Belgium ($44,587, a difference of 0.21%), and Asian ($44,586, a difference of 0.21%).
| Demographics | Rating | Rank | Median Female Earnings |
| Cambodians | 100.0 /100 | #21 | Exceptional $45,014 |
| Immigrants | Greece | 100.0 /100 | #22 | Exceptional $44,976 |
| Burmese | 100.0 /100 | #23 | Exceptional $44,911 |
| Immigrants | Korea | 100.0 /100 | #24 | Exceptional $44,847 |
| Immigrants | Sweden | 100.0 /100 | #25 | Exceptional $44,774 |
| Immigrants | Belarus | 100.0 /100 | #26 | Exceptional $44,757 |
| Turks | 100.0 /100 | #27 | Exceptional $44,695 |
| Immigrants | Russia | 100.0 /100 | #28 | Exceptional $44,680 |
| Immigrants | Belgium | 100.0 /100 | #29 | Exceptional $44,587 |
| Asians | 100.0 /100 | #30 | Exceptional $44,586 |
| Immigrants | France | 100.0 /100 | #31 | Exceptional $44,541 |
| Immigrants | Northern Europe | 100.0 /100 | #32 | Exceptional $44,366 |
| Immigrants | Asia | 100.0 /100 | #33 | Exceptional $44,198 |
| Russians | 100.0 /100 | #34 | Exceptional $44,169 |
| Immigrants | Sri Lanka | 100.0 /100 | #35 | Exceptional $44,161 |