German vs Cypriot Median Female Earnings

COMPARE

German
Race
Ancestry
AfghanAfricanAlaska NativeAlaskan AthabascanAlbanianAleutAlsatianAmericanApacheArabArapahoArgentineanArmenianAssyrian/Chaldean/SyriacAustralianAustrianBahamianBangladeshiBarbadianBasqueBelgianBelizeanBermudanBhutaneseBlackfeetBolivianBrazilianBritishBritish West IndianBulgarianBurmeseCajunCambodianCanadianCape VerdeanCarpatho RusynCelticCentral AmericanCentral American IndianCherokeeCheyenneChickasawChileanChineseChippewaChoctawColombianColvilleComancheCosta RicanCreeCreekCroatianCrowCubanCzechCzechoslovakianDanishDelawareDominicanDutchDutch West IndianEastern EuropeanEcuadorianEgyptianEnglishEstonianEthiopianEuropeanFijianFilipinoFinnishFrenchFrench American IndianFrench CanadianGermanGerman RussianGhanaianGreekGuamanian/ChamorroGuatemalanGuyaneseHaitianHmongHonduranHopiHoumaHungarianIcelanderIndian (Asian)IndonesianInupiatIranianIraqiIrishIroquoisIsraeliItalianJamaicanJapaneseJordanianKenyanKiowaKoreanLaotianLatvianLebaneseLiberianLithuanianLumbeeLuxembourgerMacedonianMalaysianMalteseMarshalleseMenomineeMexicanMexican American IndianMongolianMoroccanNative HawaiianNavajoNepaleseNew ZealanderNicaraguanNigerianNorthern EuropeanNorwegianOkinawanOsageOttawaPaiutePakistaniPalestinianPanamanianParaguayanPennsylvania GermanPeruvianPimaPolishPortuguesePotawatomiPuebloPuerto RicanPuget Sound SalishRomanianRussianSalvadoranSamoanScandinavianScotch-IrishScottishSeminoleSenegaleseSerbianShoshoneSierra LeoneanSiouxSlavicSlovakSloveneSomaliSouth AfricanSouth AmericanSouth American IndianSoviet UnionSpaniardSpanishSpanish AmericanSpanish American IndianSri LankanSubsaharan AfricanSudaneseSwedishSwissSyrianTaiwaneseThaiTlingit-HaidaTohono O'OdhamTonganTrinidadian and TobagonianTsimshianTurkishU.S. Virgin IslanderUgandanUkrainianUruguayanUteVenezuelanVietnameseWelshWest IndianYakamaYaquiYugoslavianYumanYup'ikZimbabwean
Immigration
NonimmigrantsImmigrantsAfghanistanAfricaAlbaniaArgentinaArmeniaAsiaAustraliaAustriaBahamasBangladeshBarbadosBelarusBelgiumBelizeBoliviaBosnia and HerzegovinaBrazilBulgariaBurma/MyanmarCabo VerdeCambodiaCameroonCanadaCaribbeanCentral AmericaChileChinaColombiaCongoCosta RicaCroatiaCubaCzechoslovakiaDenmarkDominicaDominican RepublicEastern AfricaEastern AsiaEastern EuropeEcuadorEgyptEl SalvadorEnglandEritreaEthiopiaEuropeFijiFranceGermanyGhanaGreeceGrenadaGuatemalaGuyanaHaitiHondurasHong KongHungaryIndiaIndonesiaIranIraqIrelandIsraelItalyJamaicaJapanJordanKazakhstanKenyaKoreaKuwaitLaosLatin AmericaLatviaLebanonLiberiaLithuaniaMalaysiaMexicoMicronesiaMiddle AfricaMoldovaMoroccoNepalNetherlandsNicaraguaNigeriaNorth AmericaNorth MacedoniaNorthern AfricaNorthern EuropeNorwayOceaniaPakistanPanamaPeruPhilippinesPolandPortugalRomaniaRussiaSaudi ArabiaScotlandSenegalSerbiaSierra LeoneSingaporeSomaliaSouth AfricaSouth AmericaSouth Central AsiaSouth Eastern AsiaSouthern EuropeSpainSri LankaSt. Vincent and the GrenadinesSudanSwedenSwitzerlandSyriaTaiwanThailandTrinidad and TobagoTurkeyUgandaUkraineUruguayUzbekistanVenezuelaVietnamWest IndiesWestern AfricaWestern AsiaWestern EuropeYemenZaireZimbabweAzores
Cypriot
Race
Ancestry
AfghanAfricanAlaska NativeAlaskan AthabascanAlbanianAleutAlsatianAmericanApacheArabArapahoArgentineanArmenianAssyrian/Chaldean/SyriacAustralianAustrianBahamianBangladeshiBarbadianBasqueBelgianBelizeanBermudanBhutaneseBlackfeetBolivianBrazilianBritishBritish West IndianBulgarianBurmeseCajunCambodianCanadianCape VerdeanCarpatho RusynCelticCentral AmericanCentral American IndianCherokeeCheyenneChickasawChileanChineseChippewaChoctawColombianColvilleComancheCosta RicanCreeCreekCroatianCrowCubanCypriotCzechCzechoslovakianDanishDelawareDominicanDutchDutch West IndianEastern EuropeanEcuadorianEgyptianEnglishEstonianEthiopianEuropeanFijianFilipinoFinnishFrenchFrench American IndianFrench CanadianGerman RussianGhanaianGreekGuamanian/ChamorroGuatemalanGuyaneseHaitianHmongHonduranHopiHoumaHungarianIcelanderIndian (Asian)IndonesianInupiatIranianIraqiIrishIroquoisIsraeliItalianJamaicanJapaneseJordanianKenyanKiowaKoreanLaotianLatvianLebaneseLiberianLithuanianLumbeeLuxembourgerMacedonianMalaysianMalteseMarshalleseMenomineeMexicanMexican American IndianMongolianMoroccanNative HawaiianNavajoNepaleseNew ZealanderNicaraguanNigerianNorthern EuropeanNorwegianOkinawanOsageOttawaPaiutePakistaniPalestinianPanamanianParaguayanPennsylvania GermanPeruvianPimaPolishPortuguesePotawatomiPuebloPuerto RicanPuget Sound SalishRomanianRussianSalvadoranSamoanScandinavianScotch-IrishScottishSeminoleSenegaleseSerbianShoshoneSierra LeoneanSiouxSlavicSlovakSloveneSomaliSouth AfricanSouth AmericanSouth American IndianSoviet UnionSpaniardSpanishSpanish AmericanSpanish American IndianSri LankanSubsaharan AfricanSudaneseSwedishSwissSyrianTaiwaneseThaiTlingit-HaidaTohono O'OdhamTonganTrinidadian and TobagonianTsimshianTurkishU.S. Virgin IslanderUgandanUkrainianUruguayanUteVenezuelanVietnameseWelshWest IndianYakamaYaquiYugoslavianYumanYup'ikZimbabwean
Immigration
NonimmigrantsImmigrantsAfghanistanAfricaAlbaniaArgentinaArmeniaAsiaAustraliaAustriaBahamasBangladeshBarbadosBelarusBelgiumBelizeBoliviaBosnia and HerzegovinaBrazilBulgariaBurma/MyanmarCabo VerdeCambodiaCameroonCanadaCaribbeanCentral AmericaChileChinaColombiaCongoCosta RicaCroatiaCubaCzechoslovakiaDenmarkDominicaDominican RepublicEastern AfricaEastern AsiaEastern EuropeEcuadorEgyptEl SalvadorEnglandEritreaEthiopiaEuropeFijiFranceGermanyGhanaGreeceGrenadaGuatemalaGuyanaHaitiHondurasHong KongHungaryIndiaIndonesiaIranIraqIrelandIsraelItalyJamaicaJapanJordanKazakhstanKenyaKoreaKuwaitLaosLatin AmericaLatviaLebanonLiberiaLithuaniaMalaysiaMexicoMicronesiaMiddle AfricaMoldovaMoroccoNepalNetherlandsNicaraguaNigeriaNorth AmericaNorth MacedoniaNorthern AfricaNorthern EuropeNorwayOceaniaPakistanPanamaPeruPhilippinesPolandPortugalRomaniaRussiaSaudi ArabiaScotlandSenegalSerbiaSierra LeoneSingaporeSomaliaSouth AfricaSouth AmericaSouth Central AsiaSouth Eastern AsiaSouthern EuropeSpainSri LankaSt. Vincent and the GrenadinesSudanSwedenSwitzerlandSyriaTaiwanThailandTrinidad and TobagoTurkeyUgandaUkraineUruguayUzbekistanVenezuelaVietnamWest IndiesWestern AfricaWestern AsiaWestern EuropeYemenZaireZimbabweAzores
Median Female Earnings
Income
Poverty
Unemployment
Labor Participation
Family Structure
Vehicle Availability
Education Level
Disability

Median Female Earnings Comparison

Germans

Cypriots

Tragic
Exceptional
$37,986
MEDIAN FEMALE EARNINGS
2.8/ 100
METRIC RATING
243rd/ 347
METRIC RANK
$45,570
MEDIAN FEMALE EARNINGS
100.0/ 100
METRIC RATING
18th/ 347
METRIC RANK

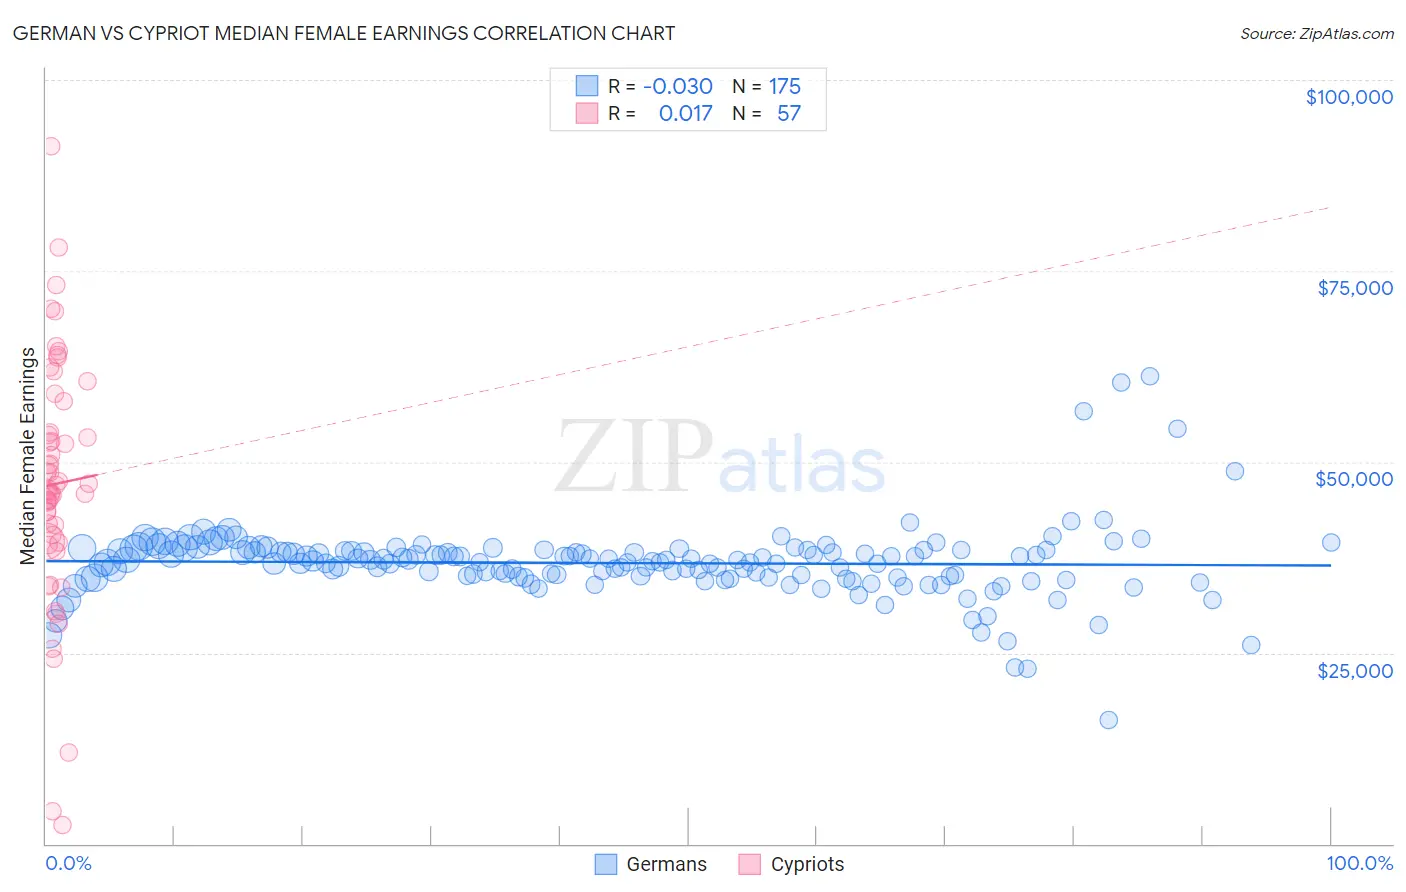
German vs Cypriot Median Female Earnings Correlation Chart

The statistical analysis conducted on geographies consisting of 578,410,378 people shows no correlation between the proportion of Germans and median female earnings in the United States with a correlation coefficient (R) of -0.030 and weighted average of $37,986. Similarly, the statistical analysis conducted on geographies consisting of 61,860,618 people shows no correlation between the proportion of Cypriots and median female earnings in the United States with a correlation coefficient (R) of 0.017 and weighted average of $45,570, a difference of 20.0%.
German vs Cypriot Median Female Earnings

Median Female Earnings Correlation Summary

MeasurementGermanCypriot
Minimum$16,161$2,499
Maximum$61,250$91,382
Range$45,089$88,883
Mean$36,748$47,121
Median$36,985$46,430
Interquartile 25% (IQ1)$34,926$39,556
Interquartile 75% (IQ3)$38,384$55,932
Interquartile Range (IQR)$3,458$16,376
Standard Deviation (Sample)$4,922$16,285
Standard Deviation (Population)$4,908$16,141

Similar Demographics by Median Female Earnings

Demographics Similar to Germans by Median Female Earnings

In terms of median female earnings, the demographic groups most similar to Germans are Immigrants from Liberia ($37,970, a difference of 0.040%), Immigrants from Middle Africa ($37,965, a difference of 0.050%), Delaware ($37,964, a difference of 0.060%), Immigrants from Burma/Myanmar ($38,028, a difference of 0.11%), and Immigrants from Somalia ($37,914, a difference of 0.19%).
DemographicsRating | RankMedian Female Earnings
Liberians
4.4
/100
|
#236
Tragic
$38,215
Immigrants | Cabo Verde
4.3
/100
|
#237
Tragic
$38,208
Alaska Natives
4.3
/100
|
#238
Tragic
$38,202
English
4.2
/100
|
#239
Tragic
$38,196
Finns
4.0
/100
|
#240
Tragic
$38,173
Spanish
3.5
/100
|
#241
Tragic
$38,098
Immigrants | Burma/Myanmar
3.0
/100
|
#242
Tragic
$38,028
Germans
2.8
/100
|
#243
Tragic
$37,986
Immigrants | Liberia
2.7
/100
|
#244
Tragic
$37,970
Immigrants | Middle Africa
2.7
/100
|
#245
Tragic
$37,965
Delaware
2.6
/100
|
#246
Tragic
$37,964
Immigrants | Somalia
2.4
/100
|
#247
Tragic
$37,914
Alaskan Athabascans
2.3
/100
|
#248
Tragic
$37,905
Swiss
2.3
/100
|
#249
Tragic
$37,904
Immigrants | Iraq
2.2
/100
|
#250
Tragic
$37,864

Demographics Similar to Cypriots by Median Female Earnings

In terms of median female earnings, the demographic groups most similar to Cypriots are Eastern European ($45,385, a difference of 0.41%), Immigrants from Japan ($45,323, a difference of 0.55%), Cambodian ($45,014, a difference of 1.2%), Immigrants from Greece ($44,976, a difference of 1.3%), and Burmese ($44,911, a difference of 1.5%).
DemographicsRating | RankMedian Female Earnings
Okinawans
100.0
/100
|
#11
Exceptional
$46,905
Immigrants | Israel
100.0
/100
|
#12
Exceptional
$46,902
Immigrants | Australia
100.0
/100
|
#13
Exceptional
$46,573
Soviet Union
100.0
/100
|
#14
Exceptional
$46,556
Immigrants | Eastern Asia
100.0
/100
|
#15
Exceptional
$46,502
Indians (Asian)
100.0
/100
|
#16
Exceptional
$46,481
Immigrants | South Central Asia
100.0
/100
|
#17
Exceptional
$46,324
Cypriots
100.0
/100
|
#18
Exceptional
$45,570
Eastern Europeans
100.0
/100
|
#19
Exceptional
$45,385
Immigrants | Japan
100.0
/100
|
#20
Exceptional
$45,323
Cambodians
100.0
/100
|
#21
Exceptional
$45,014
Immigrants | Greece
100.0
/100
|
#22
Exceptional
$44,976
Burmese
100.0
/100
|
#23
Exceptional
$44,911
Immigrants | Korea
100.0
/100
|
#24
Exceptional
$44,847
Immigrants | Sweden
100.0
/100
|
#25
Exceptional
$44,774