Chippewa vs Argentinean Median Female Earnings
COMPARE
Chippewa
Argentinean
Median Female Earnings
Median Female Earnings Comparison
Chippewa
Argentineans
$35,003
MEDIAN FEMALE EARNINGS
0.0/ 100
METRIC RATING
310th/ 347
METRIC RANK
$41,952
MEDIAN FEMALE EARNINGS
99.1/ 100
METRIC RATING
92nd/ 347
METRIC RANK
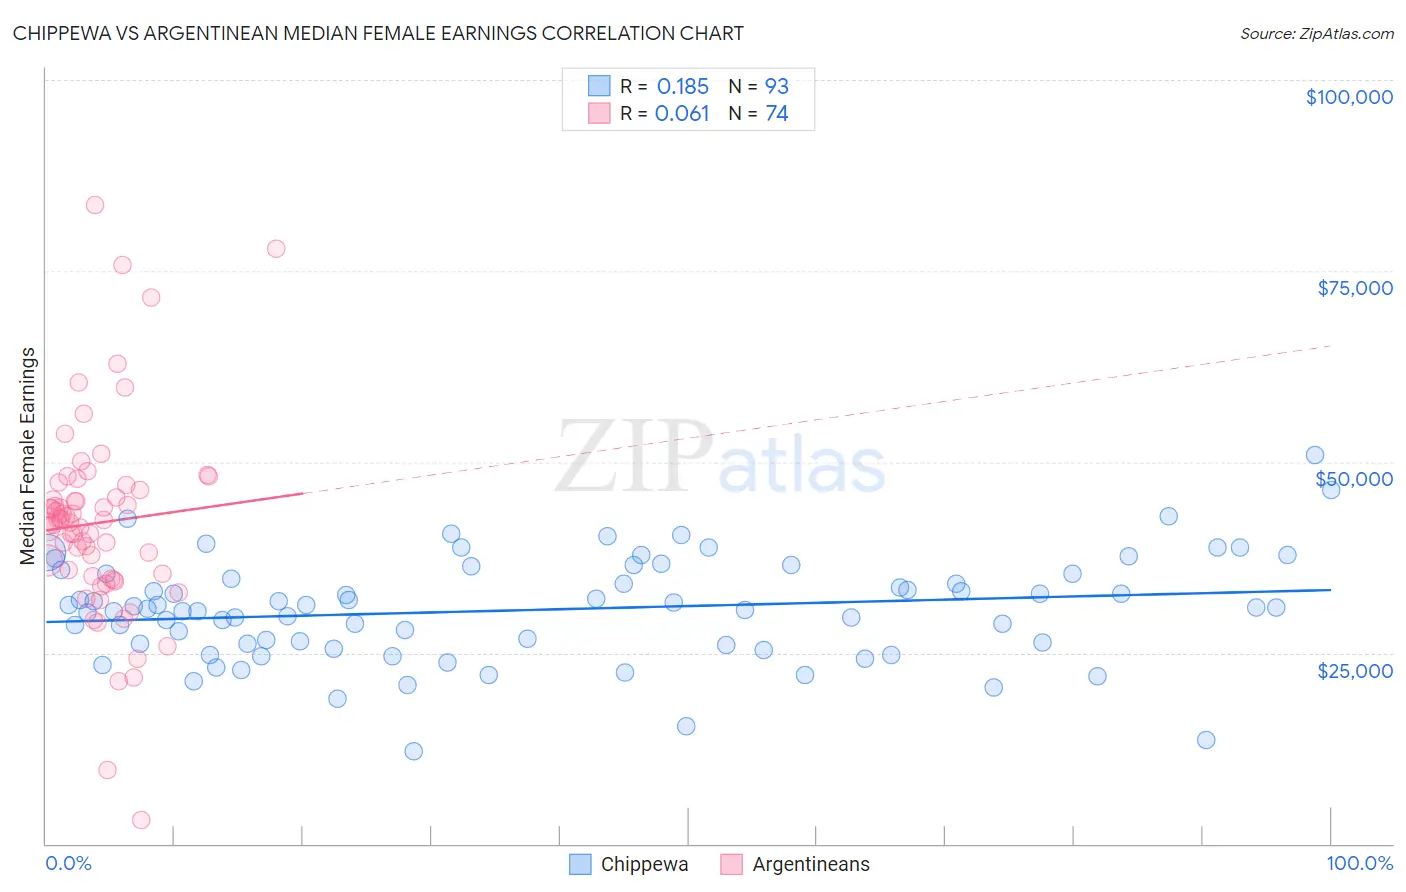
Chippewa vs Argentinean Median Female Earnings Correlation Chart
The statistical analysis conducted on geographies consisting of 214,968,178 people shows a poor positive correlation between the proportion of Chippewa and median female earnings in the United States with a correlation coefficient (R) of 0.185 and weighted average of $35,003. Similarly, the statistical analysis conducted on geographies consisting of 297,092,103 people shows a slight positive correlation between the proportion of Argentineans and median female earnings in the United States with a correlation coefficient (R) of 0.061 and weighted average of $41,952, a difference of 19.9%.
Median Female Earnings Correlation Summary
| Measurement | Chippewa | Argentinean |
| Minimum | $12,188 | $3,125 |
| Maximum | $50,958 | $83,609 |
| Range | $38,770 | $80,484 |
| Mean | $30,628 | $42,021 |
| Median | $30,893 | $42,177 |
| Interquartile 25% (IQ1) | $26,067 | $34,978 |
| Interquartile 75% (IQ3) | $35,324 | $46,250 |
| Interquartile Range (IQR) | $9,258 | $11,272 |
| Standard Deviation (Sample) | $6,851 | $13,019 |
| Standard Deviation (Population) | $6,814 | $12,930 |
Similar Demographics by Median Female Earnings
Demographics Similar to Chippewa by Median Female Earnings
In terms of median female earnings, the demographic groups most similar to Chippewa are Honduran ($35,013, a difference of 0.030%), Immigrants from Bahamas ($35,027, a difference of 0.070%), Ute ($34,960, a difference of 0.12%), Sioux ($35,063, a difference of 0.17%), and Yaqui ($34,943, a difference of 0.17%).
| Demographics | Rating | Rank | Median Female Earnings |
| Immigrants | Latin America | 0.0 /100 | #303 | Tragic $35,307 |
| Crow | 0.0 /100 | #304 | Tragic $35,266 |
| Bahamians | 0.0 /100 | #305 | Tragic $35,125 |
| Fijians | 0.0 /100 | #306 | Tragic $35,114 |
| Sioux | 0.0 /100 | #307 | Tragic $35,063 |
| Immigrants | Bahamas | 0.0 /100 | #308 | Tragic $35,027 |
| Hondurans | 0.0 /100 | #309 | Tragic $35,013 |
| Chippewa | 0.0 /100 | #310 | Tragic $35,003 |
| Ute | 0.0 /100 | #311 | Tragic $34,960 |
| Yaqui | 0.0 /100 | #312 | Tragic $34,943 |
| Cubans | 0.0 /100 | #313 | Tragic $34,942 |
| Apache | 0.0 /100 | #314 | Tragic $34,895 |
| Pennsylvania Germans | 0.0 /100 | #315 | Tragic $34,802 |
| Cherokee | 0.0 /100 | #316 | Tragic $34,742 |
| Potawatomi | 0.0 /100 | #317 | Tragic $34,739 |
Demographics Similar to Argentineans by Median Female Earnings
In terms of median female earnings, the demographic groups most similar to Argentineans are Immigrants from Grenada ($41,932, a difference of 0.050%), Immigrants from Western Europe ($41,990, a difference of 0.090%), Ukrainian ($42,015, a difference of 0.15%), Moroccan ($41,872, a difference of 0.19%), and Immigrants from Netherlands ($41,870, a difference of 0.20%).
| Demographics | Rating | Rank | Median Female Earnings |
| Laotians | 99.4 /100 | #85 | Exceptional $42,133 |
| Immigrants | St. Vincent and the Grenadines | 99.3 /100 | #86 | Exceptional $42,108 |
| Lithuanians | 99.3 /100 | #87 | Exceptional $42,108 |
| Immigrants | Northern Africa | 99.3 /100 | #88 | Exceptional $42,084 |
| Immigrants | Afghanistan | 99.3 /100 | #89 | Exceptional $42,055 |
| Ukrainians | 99.2 /100 | #90 | Exceptional $42,015 |
| Immigrants | Western Europe | 99.2 /100 | #91 | Exceptional $41,990 |
| Argentineans | 99.1 /100 | #92 | Exceptional $41,952 |
| Immigrants | Grenada | 99.0 /100 | #93 | Exceptional $41,932 |
| Moroccans | 98.9 /100 | #94 | Exceptional $41,872 |
| Immigrants | Netherlands | 98.9 /100 | #95 | Exceptional $41,870 |
| South Africans | 98.8 /100 | #96 | Exceptional $41,825 |
| Immigrants | Hungary | 98.8 /100 | #97 | Exceptional $41,820 |
| Immigrants | Scotland | 98.7 /100 | #98 | Exceptional $41,771 |
| Immigrants | Barbados | 98.4 /100 | #99 | Exceptional $41,685 |