Chippewa vs Bangladeshi Median Female Earnings
COMPARE
Chippewa
Bangladeshi
Median Female Earnings
Median Female Earnings Comparison
Chippewa
Bangladeshis
$35,003
MEDIAN FEMALE EARNINGS
0.0/ 100
METRIC RATING
310th/ 347
METRIC RANK
$35,960
MEDIAN FEMALE EARNINGS
0.0/ 100
METRIC RATING
289th/ 347
METRIC RANK
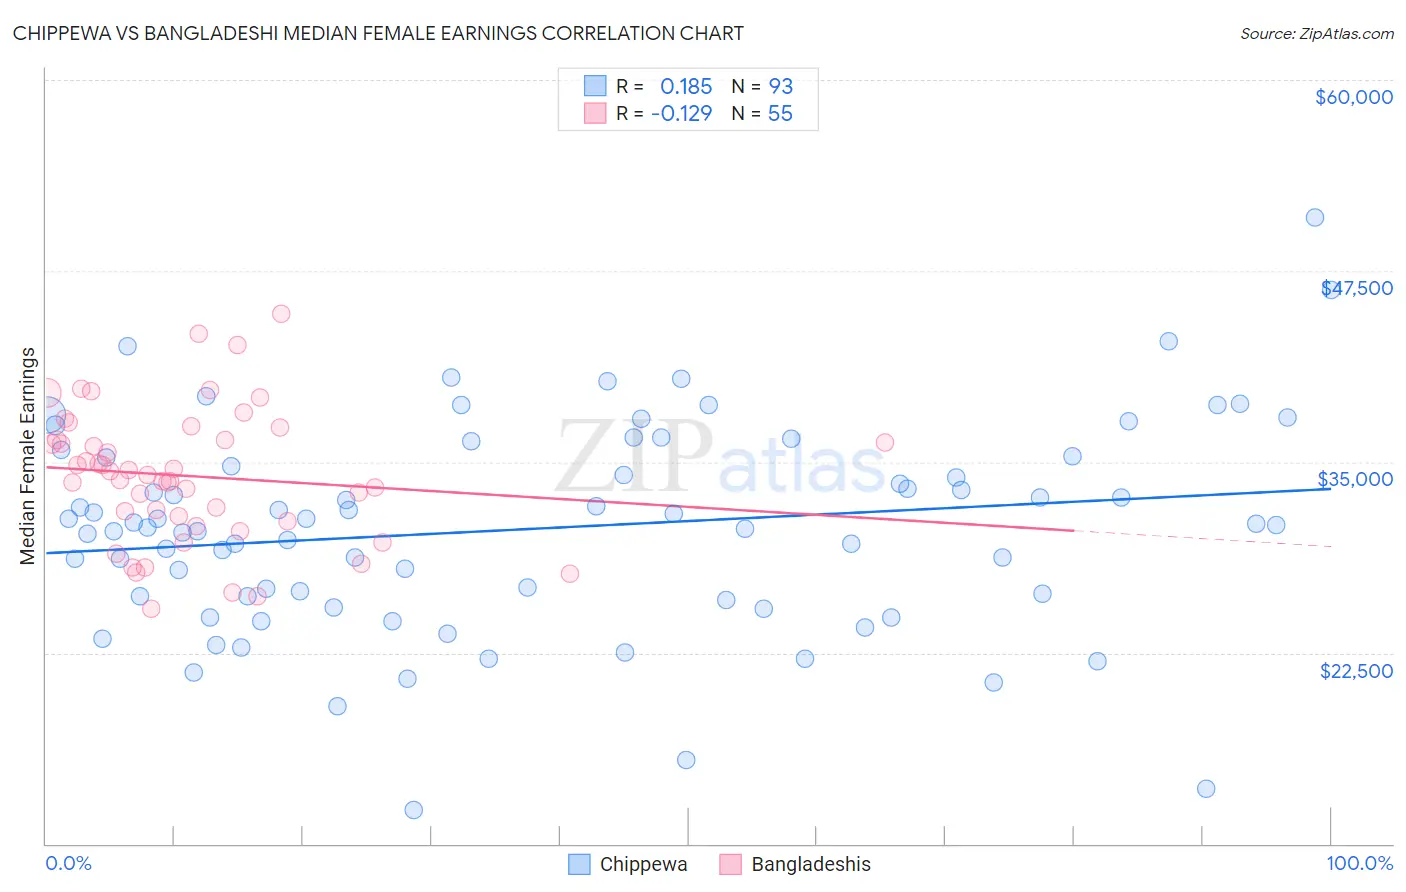
Chippewa vs Bangladeshi Median Female Earnings Correlation Chart
The statistical analysis conducted on geographies consisting of 214,968,178 people shows a poor positive correlation between the proportion of Chippewa and median female earnings in the United States with a correlation coefficient (R) of 0.185 and weighted average of $35,003. Similarly, the statistical analysis conducted on geographies consisting of 141,417,100 people shows a poor negative correlation between the proportion of Bangladeshis and median female earnings in the United States with a correlation coefficient (R) of -0.129 and weighted average of $35,960, a difference of 2.7%.
Median Female Earnings Correlation Summary
| Measurement | Chippewa | Bangladeshi |
| Minimum | $12,188 | $25,400 |
| Maximum | $50,958 | $44,719 |
| Range | $38,770 | $19,319 |
| Mean | $30,628 | $34,070 |
| Median | $30,893 | $34,114 |
| Interquartile 25% (IQ1) | $26,067 | $31,090 |
| Interquartile 75% (IQ3) | $35,324 | $36,435 |
| Interquartile Range (IQR) | $9,258 | $5,345 |
| Standard Deviation (Sample) | $6,851 | $4,364 |
| Standard Deviation (Population) | $6,814 | $4,325 |
Similar Demographics by Median Female Earnings
Demographics Similar to Chippewa by Median Female Earnings
In terms of median female earnings, the demographic groups most similar to Chippewa are Honduran ($35,013, a difference of 0.030%), Immigrants from Bahamas ($35,027, a difference of 0.070%), Ute ($34,960, a difference of 0.12%), Sioux ($35,063, a difference of 0.17%), and Yaqui ($34,943, a difference of 0.17%).
| Demographics | Rating | Rank | Median Female Earnings |
| Immigrants | Latin America | 0.0 /100 | #303 | Tragic $35,307 |
| Crow | 0.0 /100 | #304 | Tragic $35,266 |
| Bahamians | 0.0 /100 | #305 | Tragic $35,125 |
| Fijians | 0.0 /100 | #306 | Tragic $35,114 |
| Sioux | 0.0 /100 | #307 | Tragic $35,063 |
| Immigrants | Bahamas | 0.0 /100 | #308 | Tragic $35,027 |
| Hondurans | 0.0 /100 | #309 | Tragic $35,013 |
| Chippewa | 0.0 /100 | #310 | Tragic $35,003 |
| Ute | 0.0 /100 | #311 | Tragic $34,960 |
| Yaqui | 0.0 /100 | #312 | Tragic $34,943 |
| Cubans | 0.0 /100 | #313 | Tragic $34,942 |
| Apache | 0.0 /100 | #314 | Tragic $34,895 |
| Pennsylvania Germans | 0.0 /100 | #315 | Tragic $34,802 |
| Cherokee | 0.0 /100 | #316 | Tragic $34,742 |
| Potawatomi | 0.0 /100 | #317 | Tragic $34,739 |
Demographics Similar to Bangladeshis by Median Female Earnings
In terms of median female earnings, the demographic groups most similar to Bangladeshis are Central American Indian ($35,930, a difference of 0.080%), Immigrants from Zaire ($36,017, a difference of 0.16%), Immigrants from Nicaragua ($36,023, a difference of 0.17%), Osage ($36,034, a difference of 0.21%), and Paiute ($36,056, a difference of 0.27%).
| Demographics | Rating | Rank | Median Female Earnings |
| Haitians | 0.1 /100 | #282 | Tragic $36,374 |
| Immigrants | Haiti | 0.1 /100 | #283 | Tragic $36,203 |
| Indonesians | 0.1 /100 | #284 | Tragic $36,140 |
| Paiute | 0.1 /100 | #285 | Tragic $36,056 |
| Osage | 0.0 /100 | #286 | Tragic $36,034 |
| Immigrants | Nicaragua | 0.0 /100 | #287 | Tragic $36,023 |
| Immigrants | Zaire | 0.0 /100 | #288 | Tragic $36,017 |
| Bangladeshis | 0.0 /100 | #289 | Tragic $35,960 |
| Central American Indians | 0.0 /100 | #290 | Tragic $35,930 |
| Blackfeet | 0.0 /100 | #291 | Tragic $35,864 |
| Americans | 0.0 /100 | #292 | Tragic $35,777 |
| Guatemalans | 0.0 /100 | #293 | Tragic $35,695 |
| Cheyenne | 0.0 /100 | #294 | Tragic $35,673 |
| Comanche | 0.0 /100 | #295 | Tragic $35,661 |
| Mexican American Indians | 0.0 /100 | #296 | Tragic $35,629 |