U.S. Virgin Islander vs Cypriot Median Female Earnings

COMPARE

U.S. Virgin Islander
Race
Ancestry
AfghanAfricanAlaska NativeAlaskan AthabascanAlbanianAleutAlsatianAmericanApacheArabArapahoArgentineanArmenianAssyrian/Chaldean/SyriacAustralianAustrianBahamianBangladeshiBarbadianBasqueBelgianBelizeanBermudanBhutaneseBlackfeetBolivianBrazilianBritishBritish West IndianBulgarianBurmeseCajunCambodianCanadianCape VerdeanCarpatho RusynCelticCentral AmericanCentral American IndianCherokeeCheyenneChickasawChileanChineseChippewaChoctawColombianColvilleComancheCosta RicanCreeCreekCroatianCrowCubanCzechCzechoslovakianDanishDelawareDominicanDutchDutch West IndianEastern EuropeanEcuadorianEgyptianEnglishEstonianEthiopianEuropeanFijianFilipinoFinnishFrenchFrench American IndianFrench CanadianGermanGerman RussianGhanaianGreekGuamanian/ChamorroGuatemalanGuyaneseHaitianHmongHonduranHopiHoumaHungarianIcelanderIndian (Asian)IndonesianInupiatIranianIraqiIrishIroquoisIsraeliItalianJamaicanJapaneseJordanianKenyanKiowaKoreanLaotianLatvianLebaneseLiberianLithuanianLumbeeLuxembourgerMacedonianMalaysianMalteseMarshalleseMenomineeMexicanMexican American IndianMongolianMoroccanNative HawaiianNavajoNepaleseNew ZealanderNicaraguanNigerianNorthern EuropeanNorwegianOkinawanOsageOttawaPaiutePakistaniPalestinianPanamanianParaguayanPennsylvania GermanPeruvianPimaPolishPortuguesePotawatomiPuebloPuerto RicanPuget Sound SalishRomanianRussianSalvadoranSamoanScandinavianScotch-IrishScottishSeminoleSenegaleseSerbianShoshoneSierra LeoneanSiouxSlavicSlovakSloveneSomaliSouth AfricanSouth AmericanSouth American IndianSoviet UnionSpaniardSpanishSpanish AmericanSpanish American IndianSri LankanSubsaharan AfricanSudaneseSwedishSwissSyrianTaiwaneseThaiTlingit-HaidaTohono O'OdhamTonganTrinidadian and TobagonianTsimshianTurkishU.S. Virgin IslanderUgandanUkrainianUruguayanUteVenezuelanVietnameseWelshWest IndianYakamaYaquiYugoslavianYumanYup'ikZimbabwean
Immigration
NonimmigrantsImmigrantsAfghanistanAfricaAlbaniaArgentinaArmeniaAsiaAustraliaAustriaBahamasBangladeshBarbadosBelarusBelgiumBelizeBoliviaBosnia and HerzegovinaBrazilBulgariaBurma/MyanmarCabo VerdeCambodiaCameroonCanadaCaribbeanCentral AmericaChileChinaColombiaCongoCosta RicaCroatiaCubaCzechoslovakiaDenmarkDominicaDominican RepublicEastern AfricaEastern AsiaEastern EuropeEcuadorEgyptEl SalvadorEnglandEritreaEthiopiaEuropeFijiFranceGermanyGhanaGreeceGrenadaGuatemalaGuyanaHaitiHondurasHong KongHungaryIndiaIndonesiaIranIraqIrelandIsraelItalyJamaicaJapanJordanKazakhstanKenyaKoreaKuwaitLaosLatin AmericaLatviaLebanonLiberiaLithuaniaMalaysiaMexicoMicronesiaMiddle AfricaMoldovaMoroccoNepalNetherlandsNicaraguaNigeriaNorth AmericaNorth MacedoniaNorthern AfricaNorthern EuropeNorwayOceaniaPakistanPanamaPeruPhilippinesPolandPortugalRomaniaRussiaSaudi ArabiaScotlandSenegalSerbiaSierra LeoneSingaporeSomaliaSouth AfricaSouth AmericaSouth Central AsiaSouth Eastern AsiaSouthern EuropeSpainSri LankaSt. Vincent and the GrenadinesSudanSwedenSwitzerlandSyriaTaiwanThailandTrinidad and TobagoTurkeyUgandaUkraineUruguayUzbekistanVenezuelaVietnamWest IndiesWestern AfricaWestern AsiaWestern EuropeYemenZaireZimbabweAzores
Cypriot
Race
Ancestry
AfghanAfricanAlaska NativeAlaskan AthabascanAlbanianAleutAlsatianAmericanApacheArabArapahoArgentineanArmenianAssyrian/Chaldean/SyriacAustralianAustrianBahamianBangladeshiBarbadianBasqueBelgianBelizeanBermudanBhutaneseBlackfeetBolivianBrazilianBritishBritish West IndianBulgarianBurmeseCajunCambodianCanadianCape VerdeanCarpatho RusynCelticCentral AmericanCentral American IndianCherokeeCheyenneChickasawChileanChineseChippewaChoctawColombianColvilleComancheCosta RicanCreeCreekCroatianCrowCubanCypriotCzechCzechoslovakianDanishDelawareDominicanDutchDutch West IndianEastern EuropeanEcuadorianEgyptianEnglishEstonianEthiopianEuropeanFijianFilipinoFinnishFrenchFrench American IndianFrench CanadianGermanGerman RussianGhanaianGreekGuamanian/ChamorroGuatemalanGuyaneseHaitianHmongHonduranHopiHoumaHungarianIcelanderIndian (Asian)IndonesianInupiatIranianIraqiIrishIroquoisIsraeliItalianJamaicanJapaneseJordanianKenyanKiowaKoreanLaotianLatvianLebaneseLiberianLithuanianLumbeeLuxembourgerMacedonianMalaysianMalteseMarshalleseMenomineeMexicanMexican American IndianMongolianMoroccanNative HawaiianNavajoNepaleseNew ZealanderNicaraguanNigerianNorthern EuropeanNorwegianOkinawanOsageOttawaPaiutePakistaniPalestinianPanamanianParaguayanPennsylvania GermanPeruvianPimaPolishPortuguesePotawatomiPuebloPuerto RicanPuget Sound SalishRomanianRussianSalvadoranSamoanScandinavianScotch-IrishScottishSeminoleSenegaleseSerbianShoshoneSierra LeoneanSiouxSlavicSlovakSloveneSomaliSouth AfricanSouth AmericanSouth American IndianSoviet UnionSpaniardSpanishSpanish AmericanSpanish American IndianSri LankanSubsaharan AfricanSudaneseSwedishSwissSyrianTaiwaneseThaiTlingit-HaidaTohono O'OdhamTonganTrinidadian and TobagonianTsimshianTurkishUgandanUkrainianUruguayanUteVenezuelanVietnameseWelshWest IndianYakamaYaquiYugoslavianYumanYup'ikZimbabwean
Immigration
NonimmigrantsImmigrantsAfghanistanAfricaAlbaniaArgentinaArmeniaAsiaAustraliaAustriaBahamasBangladeshBarbadosBelarusBelgiumBelizeBoliviaBosnia and HerzegovinaBrazilBulgariaBurma/MyanmarCabo VerdeCambodiaCameroonCanadaCaribbeanCentral AmericaChileChinaColombiaCongoCosta RicaCroatiaCubaCzechoslovakiaDenmarkDominicaDominican RepublicEastern AfricaEastern AsiaEastern EuropeEcuadorEgyptEl SalvadorEnglandEritreaEthiopiaEuropeFijiFranceGermanyGhanaGreeceGrenadaGuatemalaGuyanaHaitiHondurasHong KongHungaryIndiaIndonesiaIranIraqIrelandIsraelItalyJamaicaJapanJordanKazakhstanKenyaKoreaKuwaitLaosLatin AmericaLatviaLebanonLiberiaLithuaniaMalaysiaMexicoMicronesiaMiddle AfricaMoldovaMoroccoNepalNetherlandsNicaraguaNigeriaNorth AmericaNorth MacedoniaNorthern AfricaNorthern EuropeNorwayOceaniaPakistanPanamaPeruPhilippinesPolandPortugalRomaniaRussiaSaudi ArabiaScotlandSenegalSerbiaSierra LeoneSingaporeSomaliaSouth AfricaSouth AmericaSouth Central AsiaSouth Eastern AsiaSouthern EuropeSpainSri LankaSt. Vincent and the GrenadinesSudanSwedenSwitzerlandSyriaTaiwanThailandTrinidad and TobagoTurkeyUgandaUkraineUruguayUzbekistanVenezuelaVietnamWest IndiesWestern AfricaWestern AsiaWestern EuropeYemenZaireZimbabweAzores
Median Female Earnings
Income
Poverty
Unemployment
Labor Participation
Family Structure
Vehicle Availability
Education Level
Disability

Median Female Earnings Comparison

U.S. Virgin Islanders

Cypriots

Tragic
Exceptional
$36,424
MEDIAN FEMALE EARNINGS
0.1/ 100
METRIC RATING
278th/ 347
METRIC RANK
$45,570
MEDIAN FEMALE EARNINGS
100.0/ 100
METRIC RATING
18th/ 347
METRIC RANK

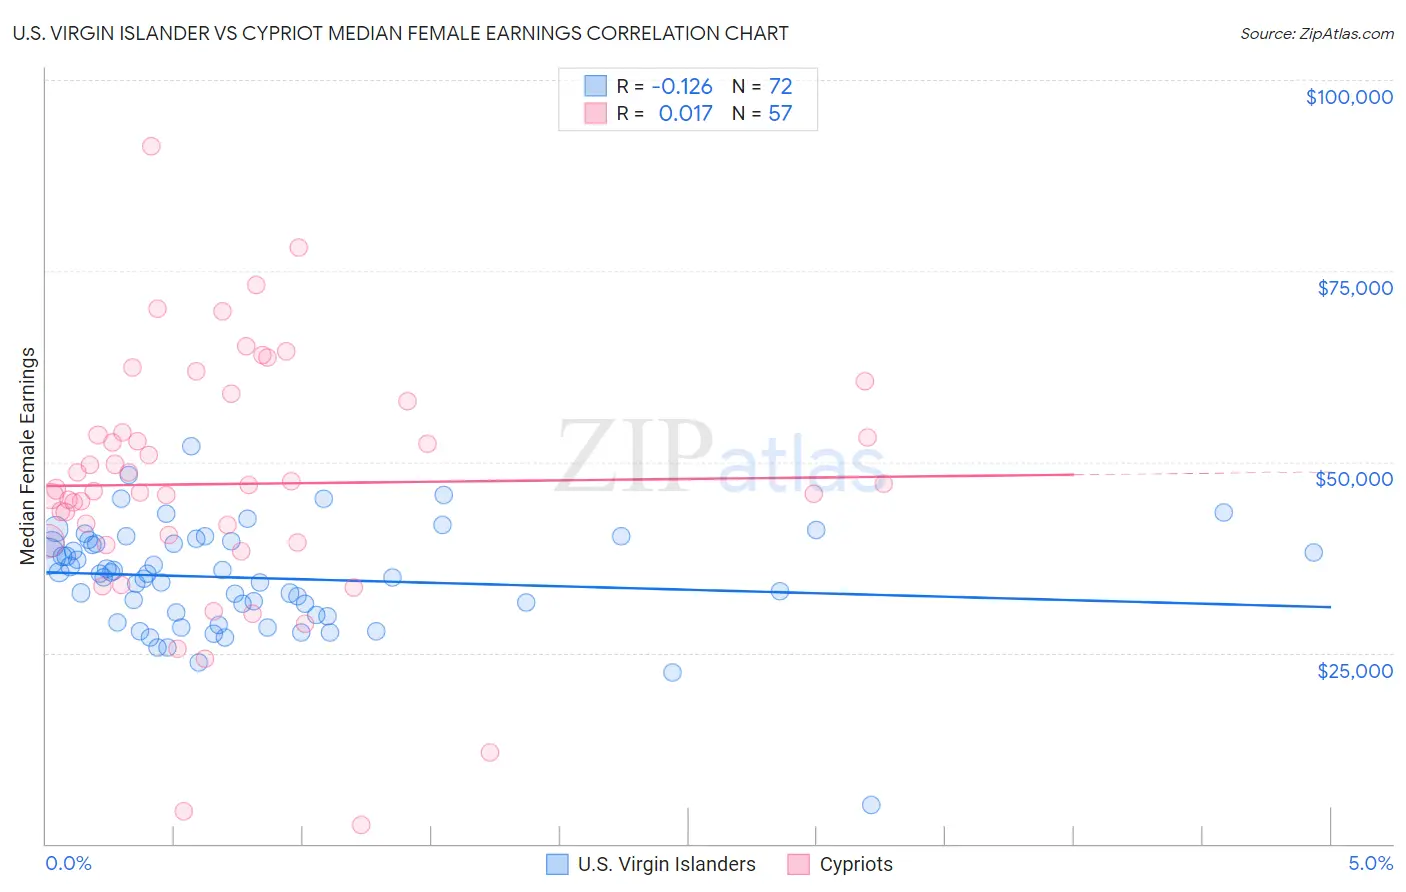
U.S. Virgin Islander vs Cypriot Median Female Earnings Correlation Chart

The statistical analysis conducted on geographies consisting of 87,518,973 people shows a poor negative correlation between the proportion of U.S. Virgin Islanders and median female earnings in the United States with a correlation coefficient (R) of -0.126 and weighted average of $36,424. Similarly, the statistical analysis conducted on geographies consisting of 61,860,618 people shows no correlation between the proportion of Cypriots and median female earnings in the United States with a correlation coefficient (R) of 0.017 and weighted average of $45,570, a difference of 25.1%.
U.S. Virgin Islander vs Cypriot Median Female Earnings

Median Female Earnings Correlation Summary

MeasurementU.S. Virgin IslanderCypriot
Minimum$5,057$2,499
Maximum$51,985$91,382
Range$46,928$88,883
Mean$34,778$47,121
Median$35,393$46,430
Interquartile 25% (IQ1)$30,098$39,556
Interquartile 75% (IQ3)$39,427$55,932
Interquartile Range (IQR)$9,329$16,376
Standard Deviation (Sample)$6,997$16,285
Standard Deviation (Population)$6,948$16,141

Similar Demographics by Median Female Earnings

Demographics Similar to U.S. Virgin Islanders by Median Female Earnings

In terms of median female earnings, the demographic groups most similar to U.S. Virgin Islanders are Immigrants from Caribbean ($36,414, a difference of 0.030%), Iroquois ($36,408, a difference of 0.050%), Spanish American ($36,391, a difference of 0.090%), Marshallese ($36,459, a difference of 0.10%), and Haitian ($36,374, a difference of 0.14%).
DemographicsRating | RankMedian Female Earnings
Nicaraguans
0.3
/100
|
#271
Tragic
$36,904
Immigrants | Dominican Republic
0.3
/100
|
#272
Tragic
$36,857
Immigrants | Laos
0.3
/100
|
#273
Tragic
$36,841
Immigrants | El Salvador
0.2
/100
|
#274
Tragic
$36,673
Africans
0.1
/100
|
#275
Tragic
$36,530
Central Americans
0.1
/100
|
#276
Tragic
$36,492
Marshallese
0.1
/100
|
#277
Tragic
$36,459
U.S. Virgin Islanders
0.1
/100
|
#278
Tragic
$36,424
Immigrants | Caribbean
0.1
/100
|
#279
Tragic
$36,414
Iroquois
0.1
/100
|
#280
Tragic
$36,408
Spanish Americans
0.1
/100
|
#281
Tragic
$36,391
Haitians
0.1
/100
|
#282
Tragic
$36,374
Immigrants | Haiti
0.1
/100
|
#283
Tragic
$36,203
Indonesians
0.1
/100
|
#284
Tragic
$36,140
Paiute
0.1
/100
|
#285
Tragic
$36,056

Demographics Similar to Cypriots by Median Female Earnings

In terms of median female earnings, the demographic groups most similar to Cypriots are Eastern European ($45,385, a difference of 0.41%), Immigrants from Japan ($45,323, a difference of 0.55%), Cambodian ($45,014, a difference of 1.2%), Immigrants from Greece ($44,976, a difference of 1.3%), and Burmese ($44,911, a difference of 1.5%).
DemographicsRating | RankMedian Female Earnings
Okinawans
100.0
/100
|
#11
Exceptional
$46,905
Immigrants | Israel
100.0
/100
|
#12
Exceptional
$46,902
Immigrants | Australia
100.0
/100
|
#13
Exceptional
$46,573
Soviet Union
100.0
/100
|
#14
Exceptional
$46,556
Immigrants | Eastern Asia
100.0
/100
|
#15
Exceptional
$46,502
Indians (Asian)
100.0
/100
|
#16
Exceptional
$46,481
Immigrants | South Central Asia
100.0
/100
|
#17
Exceptional
$46,324
Cypriots
100.0
/100
|
#18
Exceptional
$45,570
Eastern Europeans
100.0
/100
|
#19
Exceptional
$45,385
Immigrants | Japan
100.0
/100
|
#20
Exceptional
$45,323
Cambodians
100.0
/100
|
#21
Exceptional
$45,014
Immigrants | Greece
100.0
/100
|
#22
Exceptional
$44,976
Burmese
100.0
/100
|
#23
Exceptional
$44,911
Immigrants | Korea
100.0
/100
|
#24
Exceptional
$44,847
Immigrants | Sweden
100.0
/100
|
#25
Exceptional
$44,774