Chippewa vs South American Indian Median Female Earnings
COMPARE
Chippewa
South American Indian
Median Female Earnings
Median Female Earnings Comparison
Chippewa
South American Indians
$35,003
MEDIAN FEMALE EARNINGS
0.0/ 100
METRIC RATING
310th/ 347
METRIC RANK
$40,019
MEDIAN FEMALE EARNINGS
66.1/ 100
METRIC RATING
162nd/ 347
METRIC RANK
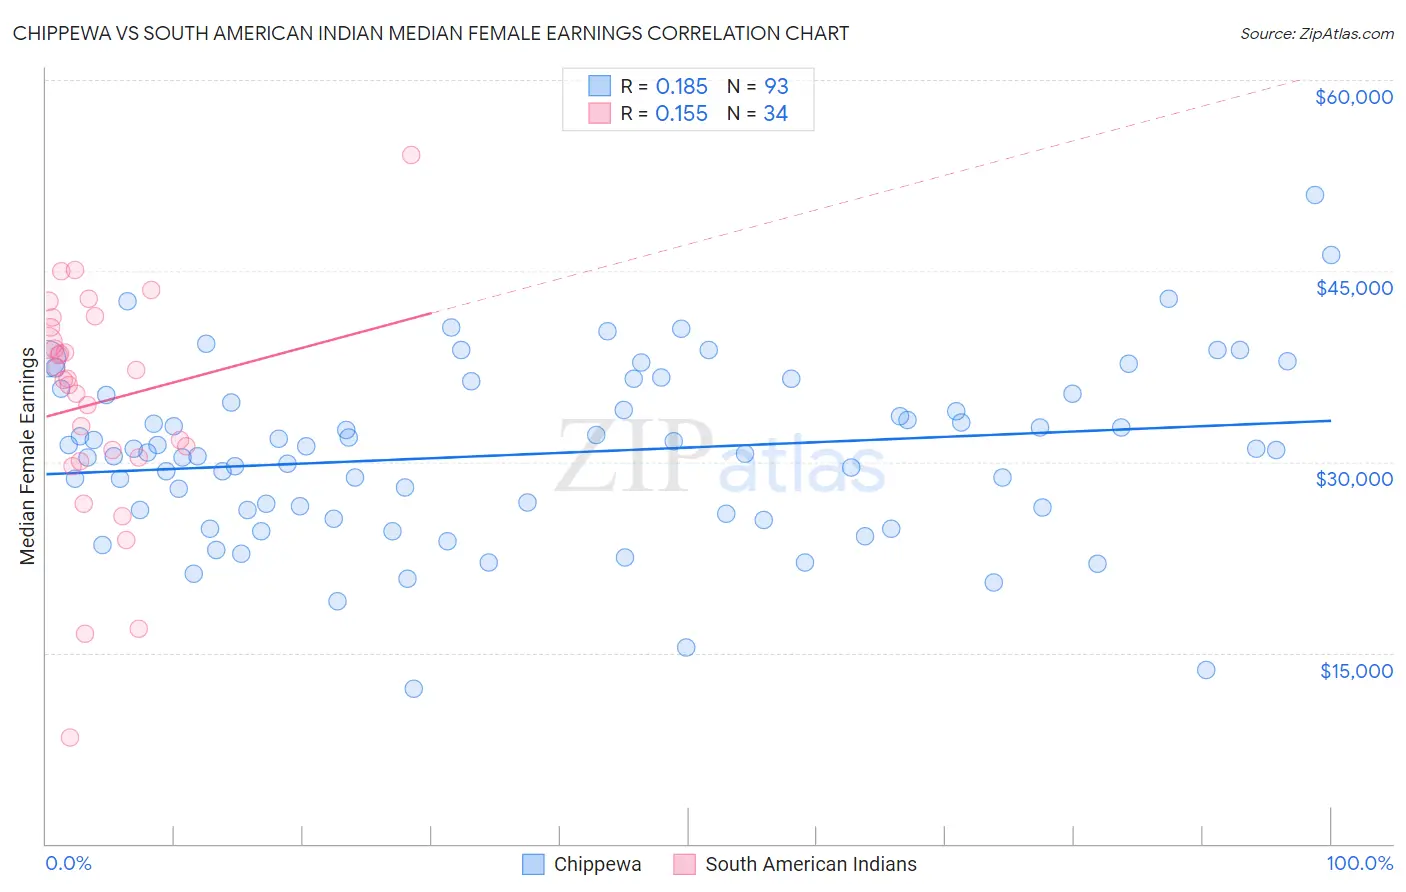
Chippewa vs South American Indian Median Female Earnings Correlation Chart
The statistical analysis conducted on geographies consisting of 214,968,178 people shows a poor positive correlation between the proportion of Chippewa and median female earnings in the United States with a correlation coefficient (R) of 0.185 and weighted average of $35,003. Similarly, the statistical analysis conducted on geographies consisting of 164,550,240 people shows a poor positive correlation between the proportion of South American Indians and median female earnings in the United States with a correlation coefficient (R) of 0.155 and weighted average of $40,019, a difference of 14.3%.
Median Female Earnings Correlation Summary
| Measurement | Chippewa | South American Indian |
| Minimum | $12,188 | $8,321 |
| Maximum | $50,958 | $54,063 |
| Range | $38,770 | $45,742 |
| Mean | $30,628 | $34,663 |
| Median | $30,893 | $36,494 |
| Interquartile 25% (IQ1) | $26,067 | $30,375 |
| Interquartile 75% (IQ3) | $35,324 | $40,581 |
| Interquartile Range (IQR) | $9,258 | $10,206 |
| Standard Deviation (Sample) | $6,851 | $9,098 |
| Standard Deviation (Population) | $6,814 | $8,963 |
Similar Demographics by Median Female Earnings
Demographics Similar to Chippewa by Median Female Earnings
In terms of median female earnings, the demographic groups most similar to Chippewa are Honduran ($35,013, a difference of 0.030%), Immigrants from Bahamas ($35,027, a difference of 0.070%), Ute ($34,960, a difference of 0.12%), Sioux ($35,063, a difference of 0.17%), and Yaqui ($34,943, a difference of 0.17%).
| Demographics | Rating | Rank | Median Female Earnings |
| Immigrants | Latin America | 0.0 /100 | #303 | Tragic $35,307 |
| Crow | 0.0 /100 | #304 | Tragic $35,266 |
| Bahamians | 0.0 /100 | #305 | Tragic $35,125 |
| Fijians | 0.0 /100 | #306 | Tragic $35,114 |
| Sioux | 0.0 /100 | #307 | Tragic $35,063 |
| Immigrants | Bahamas | 0.0 /100 | #308 | Tragic $35,027 |
| Hondurans | 0.0 /100 | #309 | Tragic $35,013 |
| Chippewa | 0.0 /100 | #310 | Tragic $35,003 |
| Ute | 0.0 /100 | #311 | Tragic $34,960 |
| Yaqui | 0.0 /100 | #312 | Tragic $34,943 |
| Cubans | 0.0 /100 | #313 | Tragic $34,942 |
| Apache | 0.0 /100 | #314 | Tragic $34,895 |
| Pennsylvania Germans | 0.0 /100 | #315 | Tragic $34,802 |
| Cherokee | 0.0 /100 | #316 | Tragic $34,742 |
| Potawatomi | 0.0 /100 | #317 | Tragic $34,739 |
Demographics Similar to South American Indians by Median Female Earnings
In terms of median female earnings, the demographic groups most similar to South American Indians are Lebanese ($40,006, a difference of 0.030%), Alsatian ($40,060, a difference of 0.10%), Inupiat ($40,080, a difference of 0.15%), Immigrants from Saudi Arabia ($39,952, a difference of 0.17%), and Immigrants from Bangladesh ($39,910, a difference of 0.27%).
| Demographics | Rating | Rank | Median Female Earnings |
| Immigrants | Africa | 76.2 /100 | #155 | Good $40,257 |
| Peruvians | 75.3 /100 | #156 | Good $40,234 |
| Portuguese | 73.0 /100 | #157 | Good $40,177 |
| Immigrants | Senegal | 72.2 /100 | #158 | Good $40,157 |
| Immigrants | Vietnam | 72.0 /100 | #159 | Good $40,153 |
| Inupiat | 68.9 /100 | #160 | Good $40,080 |
| Alsatians | 68.0 /100 | #161 | Good $40,060 |
| South American Indians | 66.1 /100 | #162 | Good $40,019 |
| Lebanese | 65.5 /100 | #163 | Good $40,006 |
| Immigrants | Saudi Arabia | 62.9 /100 | #164 | Good $39,952 |
| Immigrants | Bangladesh | 60.8 /100 | #165 | Good $39,910 |
| Immigrants | Ghana | 60.0 /100 | #166 | Good $39,894 |
| Luxembourgers | 59.9 /100 | #167 | Average $39,891 |
| Immigrants | Peru | 58.9 /100 | #168 | Average $39,871 |
| Kenyans | 58.4 /100 | #169 | Average $39,860 |