Belizean vs Cypriot Median Female Earnings
COMPARE
Belizean
Cypriot
Median Female Earnings
Median Female Earnings Comparison
Belizeans
Cypriots
$37,429
MEDIAN FEMALE EARNINGS
0.9/ 100
METRIC RATING
258th/ 347
METRIC RANK
$45,570
MEDIAN FEMALE EARNINGS
100.0/ 100
METRIC RATING
18th/ 347
METRIC RANK
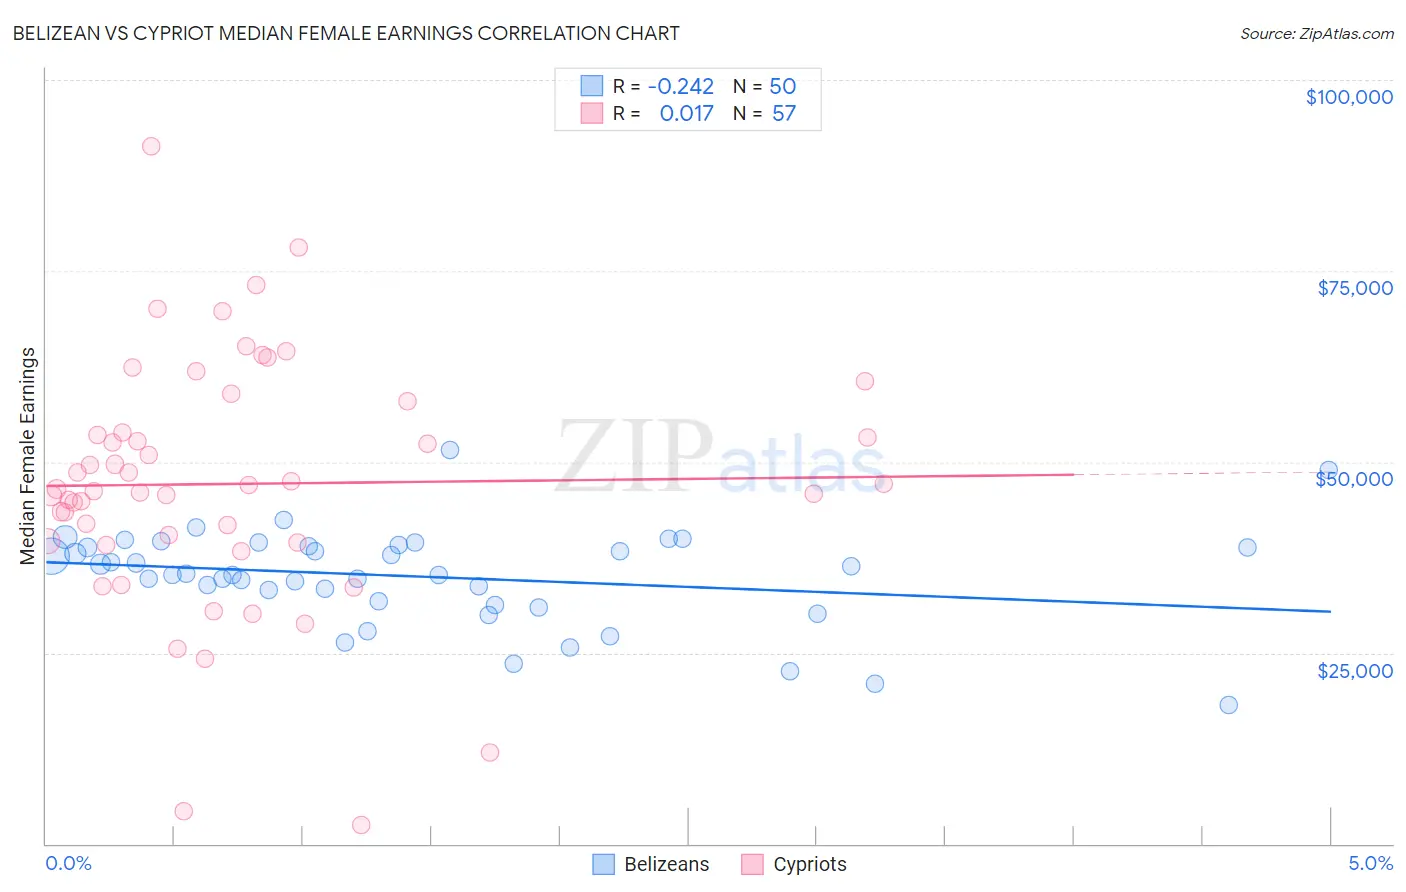
Belizean vs Cypriot Median Female Earnings Correlation Chart
The statistical analysis conducted on geographies consisting of 144,203,712 people shows a weak negative correlation between the proportion of Belizeans and median female earnings in the United States with a correlation coefficient (R) of -0.242 and weighted average of $37,429. Similarly, the statistical analysis conducted on geographies consisting of 61,860,618 people shows no correlation between the proportion of Cypriots and median female earnings in the United States with a correlation coefficient (R) of 0.017 and weighted average of $45,570, a difference of 21.7%.
Median Female Earnings Correlation Summary
| Measurement | Belizean | Cypriot |
| Minimum | $18,201 | $2,499 |
| Maximum | $51,565 | $91,382 |
| Range | $33,364 | $88,883 |
| Mean | $34,988 | $47,121 |
| Median | $35,337 | $46,430 |
| Interquartile 25% (IQ1) | $31,707 | $39,556 |
| Interquartile 75% (IQ3) | $38,920 | $55,932 |
| Interquartile Range (IQR) | $7,213 | $16,376 |
| Standard Deviation (Sample) | $6,353 | $16,285 |
| Standard Deviation (Population) | $6,289 | $16,141 |
Similar Demographics by Median Female Earnings
Demographics Similar to Belizeans by Median Female Earnings
In terms of median female earnings, the demographic groups most similar to Belizeans are Scotch-Irish ($37,383, a difference of 0.12%), Hawaiian ($37,497, a difference of 0.18%), Samoan ($37,498, a difference of 0.19%), Colville ($37,514, a difference of 0.23%), and Dutch ($37,339, a difference of 0.24%).
| Demographics | Rating | Rank | Median Female Earnings |
| Welsh | 2.1 /100 | #251 | Tragic $37,856 |
| Immigrants | Dominica | 2.0 /100 | #252 | Tragic $37,825 |
| Danes | 1.6 /100 | #253 | Tragic $37,730 |
| Whites/Caucasians | 1.1 /100 | #254 | Tragic $37,531 |
| Colville | 1.1 /100 | #255 | Tragic $37,514 |
| Samoans | 1.0 /100 | #256 | Tragic $37,498 |
| Hawaiians | 1.0 /100 | #257 | Tragic $37,497 |
| Belizeans | 0.9 /100 | #258 | Tragic $37,429 |
| Scotch-Irish | 0.8 /100 | #259 | Tragic $37,383 |
| Dutch | 0.7 /100 | #260 | Tragic $37,339 |
| Malaysians | 0.7 /100 | #261 | Tragic $37,298 |
| Venezuelans | 0.7 /100 | #262 | Tragic $37,282 |
| German Russians | 0.5 /100 | #263 | Tragic $37,105 |
| Salvadorans | 0.4 /100 | #264 | Tragic $37,083 |
| Immigrants | Belize | 0.4 /100 | #265 | Tragic $37,056 |
Demographics Similar to Cypriots by Median Female Earnings
In terms of median female earnings, the demographic groups most similar to Cypriots are Eastern European ($45,385, a difference of 0.41%), Immigrants from Japan ($45,323, a difference of 0.55%), Cambodian ($45,014, a difference of 1.2%), Immigrants from Greece ($44,976, a difference of 1.3%), and Burmese ($44,911, a difference of 1.5%).
| Demographics | Rating | Rank | Median Female Earnings |
| Okinawans | 100.0 /100 | #11 | Exceptional $46,905 |
| Immigrants | Israel | 100.0 /100 | #12 | Exceptional $46,902 |
| Immigrants | Australia | 100.0 /100 | #13 | Exceptional $46,573 |
| Soviet Union | 100.0 /100 | #14 | Exceptional $46,556 |
| Immigrants | Eastern Asia | 100.0 /100 | #15 | Exceptional $46,502 |
| Indians (Asian) | 100.0 /100 | #16 | Exceptional $46,481 |
| Immigrants | South Central Asia | 100.0 /100 | #17 | Exceptional $46,324 |
| Cypriots | 100.0 /100 | #18 | Exceptional $45,570 |
| Eastern Europeans | 100.0 /100 | #19 | Exceptional $45,385 |
| Immigrants | Japan | 100.0 /100 | #20 | Exceptional $45,323 |
| Cambodians | 100.0 /100 | #21 | Exceptional $45,014 |
| Immigrants | Greece | 100.0 /100 | #22 | Exceptional $44,976 |
| Burmese | 100.0 /100 | #23 | Exceptional $44,911 |
| Immigrants | Korea | 100.0 /100 | #24 | Exceptional $44,847 |
| Immigrants | Sweden | 100.0 /100 | #25 | Exceptional $44,774 |