Inupiat vs Cypriot Median Female Earnings
COMPARE
Inupiat
Cypriot
Median Female Earnings
Median Female Earnings Comparison
Inupiat
Cypriots
$40,080
MEDIAN FEMALE EARNINGS
68.9/ 100
METRIC RATING
160th/ 347
METRIC RANK
$45,570
MEDIAN FEMALE EARNINGS
100.0/ 100
METRIC RATING
18th/ 347
METRIC RANK
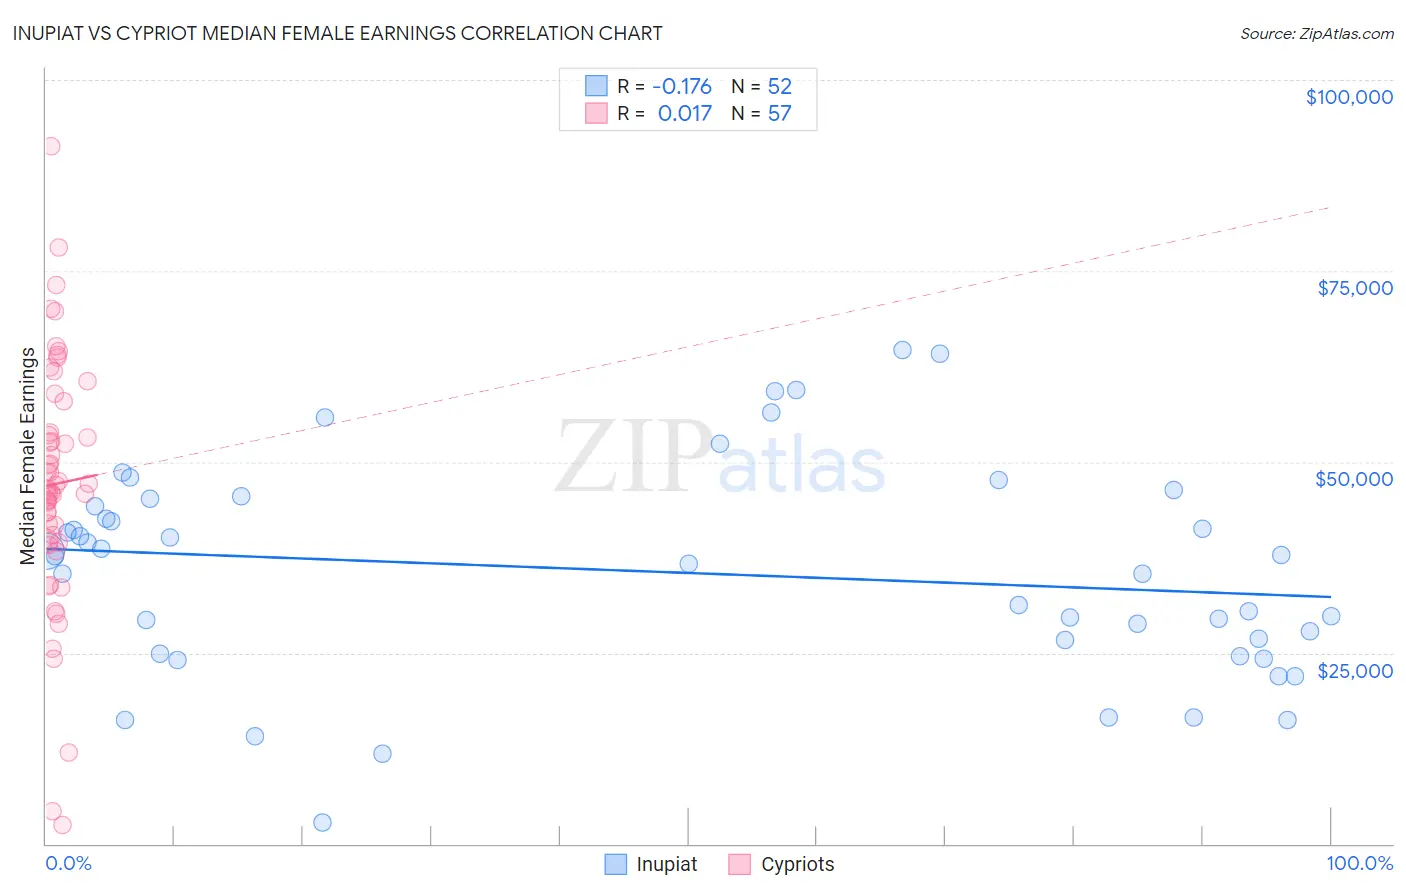
Inupiat vs Cypriot Median Female Earnings Correlation Chart
The statistical analysis conducted on geographies consisting of 96,311,190 people shows a poor negative correlation between the proportion of Inupiat and median female earnings in the United States with a correlation coefficient (R) of -0.176 and weighted average of $40,080. Similarly, the statistical analysis conducted on geographies consisting of 61,860,618 people shows no correlation between the proportion of Cypriots and median female earnings in the United States with a correlation coefficient (R) of 0.017 and weighted average of $45,570, a difference of 13.7%.
Median Female Earnings Correlation Summary
| Measurement | Inupiat | Cypriot |
| Minimum | $2,800 | $2,499 |
| Maximum | $64,688 | $91,382 |
| Range | $61,888 | $88,883 |
| Mean | $35,589 | $47,121 |
| Median | $37,155 | $46,430 |
| Interquartile 25% (IQ1) | $25,800 | $39,556 |
| Interquartile 75% (IQ3) | $44,695 | $55,932 |
| Interquartile Range (IQR) | $18,895 | $16,376 |
| Standard Deviation (Sample) | $13,962 | $16,285 |
| Standard Deviation (Population) | $13,827 | $16,141 |
Similar Demographics by Median Female Earnings
Demographics Similar to Inupiat by Median Female Earnings
In terms of median female earnings, the demographic groups most similar to Inupiat are Alsatian ($40,060, a difference of 0.050%), South American Indian ($40,019, a difference of 0.15%), Immigrants from Vietnam ($40,153, a difference of 0.18%), Lebanese ($40,006, a difference of 0.18%), and Immigrants from Senegal ($40,157, a difference of 0.19%).
| Demographics | Rating | Rank | Median Female Earnings |
| British West Indians | 77.7 /100 | #153 | Good $40,299 |
| Immigrants | Oceania | 77.6 /100 | #154 | Good $40,297 |
| Immigrants | Africa | 76.2 /100 | #155 | Good $40,257 |
| Peruvians | 75.3 /100 | #156 | Good $40,234 |
| Portuguese | 73.0 /100 | #157 | Good $40,177 |
| Immigrants | Senegal | 72.2 /100 | #158 | Good $40,157 |
| Immigrants | Vietnam | 72.0 /100 | #159 | Good $40,153 |
| Inupiat | 68.9 /100 | #160 | Good $40,080 |
| Alsatians | 68.0 /100 | #161 | Good $40,060 |
| South American Indians | 66.1 /100 | #162 | Good $40,019 |
| Lebanese | 65.5 /100 | #163 | Good $40,006 |
| Immigrants | Saudi Arabia | 62.9 /100 | #164 | Good $39,952 |
| Immigrants | Bangladesh | 60.8 /100 | #165 | Good $39,910 |
| Immigrants | Ghana | 60.0 /100 | #166 | Good $39,894 |
| Luxembourgers | 59.9 /100 | #167 | Average $39,891 |
Demographics Similar to Cypriots by Median Female Earnings
In terms of median female earnings, the demographic groups most similar to Cypriots are Eastern European ($45,385, a difference of 0.41%), Immigrants from Japan ($45,323, a difference of 0.55%), Cambodian ($45,014, a difference of 1.2%), Immigrants from Greece ($44,976, a difference of 1.3%), and Burmese ($44,911, a difference of 1.5%).
| Demographics | Rating | Rank | Median Female Earnings |
| Okinawans | 100.0 /100 | #11 | Exceptional $46,905 |
| Immigrants | Israel | 100.0 /100 | #12 | Exceptional $46,902 |
| Immigrants | Australia | 100.0 /100 | #13 | Exceptional $46,573 |
| Soviet Union | 100.0 /100 | #14 | Exceptional $46,556 |
| Immigrants | Eastern Asia | 100.0 /100 | #15 | Exceptional $46,502 |
| Indians (Asian) | 100.0 /100 | #16 | Exceptional $46,481 |
| Immigrants | South Central Asia | 100.0 /100 | #17 | Exceptional $46,324 |
| Cypriots | 100.0 /100 | #18 | Exceptional $45,570 |
| Eastern Europeans | 100.0 /100 | #19 | Exceptional $45,385 |
| Immigrants | Japan | 100.0 /100 | #20 | Exceptional $45,323 |
| Cambodians | 100.0 /100 | #21 | Exceptional $45,014 |
| Immigrants | Greece | 100.0 /100 | #22 | Exceptional $44,976 |
| Burmese | 100.0 /100 | #23 | Exceptional $44,911 |
| Immigrants | Korea | 100.0 /100 | #24 | Exceptional $44,847 |
| Immigrants | Sweden | 100.0 /100 | #25 | Exceptional $44,774 |