South African vs Cypriot Median Female Earnings
COMPARE
South African
Cypriot
Median Female Earnings
Median Female Earnings Comparison
South Africans
Cypriots
$41,825
MEDIAN FEMALE EARNINGS
98.8/ 100
METRIC RATING
96th/ 347
METRIC RANK
$45,570
MEDIAN FEMALE EARNINGS
100.0/ 100
METRIC RATING
18th/ 347
METRIC RANK
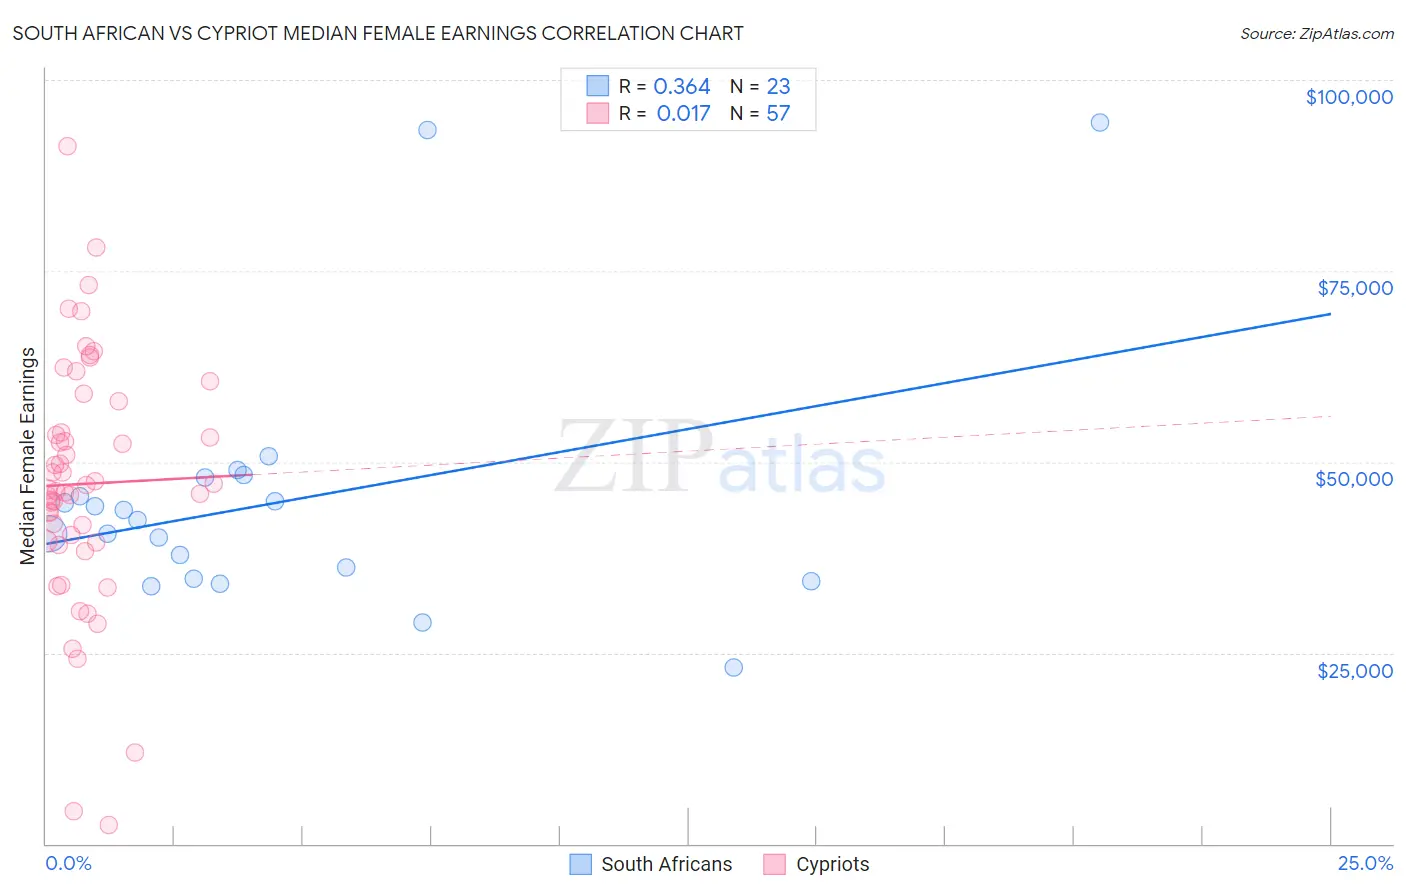
South African vs Cypriot Median Female Earnings Correlation Chart
The statistical analysis conducted on geographies consisting of 182,555,636 people shows a mild positive correlation between the proportion of South Africans and median female earnings in the United States with a correlation coefficient (R) of 0.364 and weighted average of $41,825. Similarly, the statistical analysis conducted on geographies consisting of 61,860,618 people shows no correlation between the proportion of Cypriots and median female earnings in the United States with a correlation coefficient (R) of 0.017 and weighted average of $45,570, a difference of 8.9%.
Median Female Earnings Correlation Summary
| Measurement | South African | Cypriot |
| Minimum | $23,068 | $2,499 |
| Maximum | $94,510 | $91,382 |
| Range | $71,442 | $88,883 |
| Mean | $44,927 | $47,121 |
| Median | $42,310 | $46,430 |
| Interquartile 25% (IQ1) | $34,713 | $39,556 |
| Interquartile 75% (IQ3) | $47,886 | $55,932 |
| Interquartile Range (IQR) | $13,173 | $16,376 |
| Standard Deviation (Sample) | $16,884 | $16,285 |
| Standard Deviation (Population) | $16,513 | $16,141 |
Similar Demographics by Median Female Earnings
Demographics Similar to South Africans by Median Female Earnings
In terms of median female earnings, the demographic groups most similar to South Africans are Immigrants from Hungary ($41,820, a difference of 0.010%), Moroccan ($41,872, a difference of 0.11%), Immigrants from Netherlands ($41,870, a difference of 0.11%), Immigrants from Scotland ($41,771, a difference of 0.13%), and Immigrants from Grenada ($41,932, a difference of 0.26%).
| Demographics | Rating | Rank | Median Female Earnings |
| Immigrants | Afghanistan | 99.3 /100 | #89 | Exceptional $42,055 |
| Ukrainians | 99.2 /100 | #90 | Exceptional $42,015 |
| Immigrants | Western Europe | 99.2 /100 | #91 | Exceptional $41,990 |
| Argentineans | 99.1 /100 | #92 | Exceptional $41,952 |
| Immigrants | Grenada | 99.0 /100 | #93 | Exceptional $41,932 |
| Moroccans | 98.9 /100 | #94 | Exceptional $41,872 |
| Immigrants | Netherlands | 98.9 /100 | #95 | Exceptional $41,870 |
| South Africans | 98.8 /100 | #96 | Exceptional $41,825 |
| Immigrants | Hungary | 98.8 /100 | #97 | Exceptional $41,820 |
| Immigrants | Scotland | 98.7 /100 | #98 | Exceptional $41,771 |
| Immigrants | Barbados | 98.4 /100 | #99 | Exceptional $41,685 |
| Romanians | 98.3 /100 | #100 | Exceptional $41,663 |
| Immigrants | Fiji | 98.3 /100 | #101 | Exceptional $41,656 |
| Immigrants | Poland | 98.2 /100 | #102 | Exceptional $41,630 |
| Immigrants | Argentina | 97.9 /100 | #103 | Exceptional $41,554 |
Demographics Similar to Cypriots by Median Female Earnings
In terms of median female earnings, the demographic groups most similar to Cypriots are Eastern European ($45,385, a difference of 0.41%), Immigrants from Japan ($45,323, a difference of 0.55%), Cambodian ($45,014, a difference of 1.2%), Immigrants from Greece ($44,976, a difference of 1.3%), and Burmese ($44,911, a difference of 1.5%).
| Demographics | Rating | Rank | Median Female Earnings |
| Okinawans | 100.0 /100 | #11 | Exceptional $46,905 |
| Immigrants | Israel | 100.0 /100 | #12 | Exceptional $46,902 |
| Immigrants | Australia | 100.0 /100 | #13 | Exceptional $46,573 |
| Soviet Union | 100.0 /100 | #14 | Exceptional $46,556 |
| Immigrants | Eastern Asia | 100.0 /100 | #15 | Exceptional $46,502 |
| Indians (Asian) | 100.0 /100 | #16 | Exceptional $46,481 |
| Immigrants | South Central Asia | 100.0 /100 | #17 | Exceptional $46,324 |
| Cypriots | 100.0 /100 | #18 | Exceptional $45,570 |
| Eastern Europeans | 100.0 /100 | #19 | Exceptional $45,385 |
| Immigrants | Japan | 100.0 /100 | #20 | Exceptional $45,323 |
| Cambodians | 100.0 /100 | #21 | Exceptional $45,014 |
| Immigrants | Greece | 100.0 /100 | #22 | Exceptional $44,976 |
| Burmese | 100.0 /100 | #23 | Exceptional $44,911 |
| Immigrants | Korea | 100.0 /100 | #24 | Exceptional $44,847 |
| Immigrants | Sweden | 100.0 /100 | #25 | Exceptional $44,774 |