Chippewa vs Iroquois Median Female Earnings
COMPARE
Chippewa
Iroquois
Median Female Earnings
Median Female Earnings Comparison
Chippewa
Iroquois
$35,003
MEDIAN FEMALE EARNINGS
0.0/ 100
METRIC RATING
310th/ 347
METRIC RANK
$36,408
MEDIAN FEMALE EARNINGS
0.1/ 100
METRIC RATING
280th/ 347
METRIC RANK
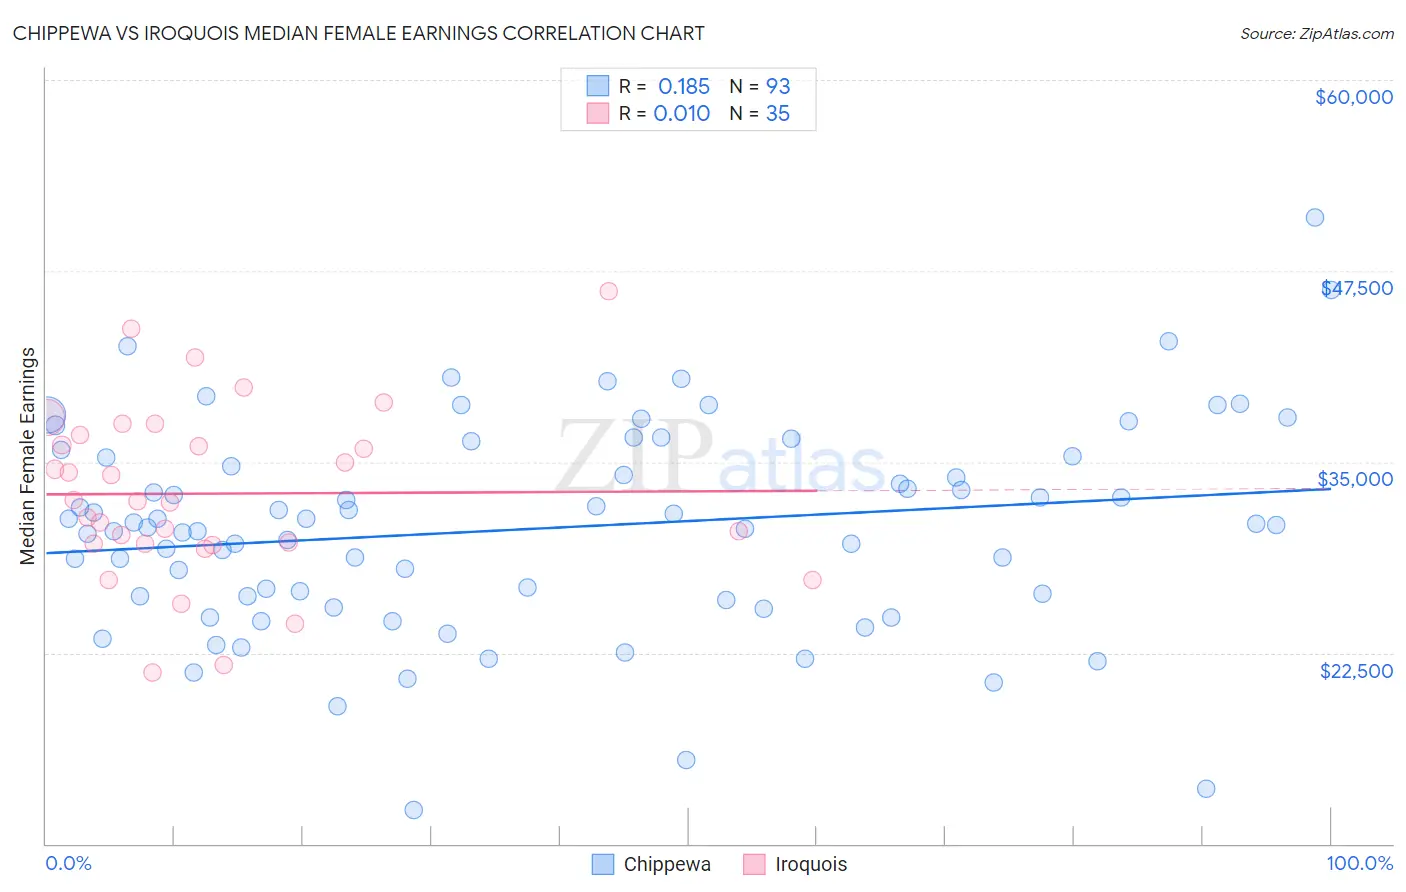
Chippewa vs Iroquois Median Female Earnings Correlation Chart
The statistical analysis conducted on geographies consisting of 214,968,178 people shows a poor positive correlation between the proportion of Chippewa and median female earnings in the United States with a correlation coefficient (R) of 0.185 and weighted average of $35,003. Similarly, the statistical analysis conducted on geographies consisting of 207,213,781 people shows no correlation between the proportion of Iroquois and median female earnings in the United States with a correlation coefficient (R) of 0.010 and weighted average of $36,408, a difference of 4.0%.
Median Female Earnings Correlation Summary
| Measurement | Chippewa | Iroquois |
| Minimum | $12,188 | $21,202 |
| Maximum | $50,958 | $46,154 |
| Range | $38,770 | $24,952 |
| Mean | $30,628 | $32,927 |
| Median | $30,893 | $32,405 |
| Interquartile 25% (IQ1) | $26,067 | $29,643 |
| Interquartile 75% (IQ3) | $35,324 | $36,768 |
| Interquartile Range (IQR) | $9,258 | $7,125 |
| Standard Deviation (Sample) | $6,851 | $5,712 |
| Standard Deviation (Population) | $6,814 | $5,630 |
Similar Demographics by Median Female Earnings
Demographics Similar to Chippewa by Median Female Earnings
In terms of median female earnings, the demographic groups most similar to Chippewa are Honduran ($35,013, a difference of 0.030%), Immigrants from Bahamas ($35,027, a difference of 0.070%), Ute ($34,960, a difference of 0.12%), Sioux ($35,063, a difference of 0.17%), and Yaqui ($34,943, a difference of 0.17%).
| Demographics | Rating | Rank | Median Female Earnings |
| Immigrants | Latin America | 0.0 /100 | #303 | Tragic $35,307 |
| Crow | 0.0 /100 | #304 | Tragic $35,266 |
| Bahamians | 0.0 /100 | #305 | Tragic $35,125 |
| Fijians | 0.0 /100 | #306 | Tragic $35,114 |
| Sioux | 0.0 /100 | #307 | Tragic $35,063 |
| Immigrants | Bahamas | 0.0 /100 | #308 | Tragic $35,027 |
| Hondurans | 0.0 /100 | #309 | Tragic $35,013 |
| Chippewa | 0.0 /100 | #310 | Tragic $35,003 |
| Ute | 0.0 /100 | #311 | Tragic $34,960 |
| Yaqui | 0.0 /100 | #312 | Tragic $34,943 |
| Cubans | 0.0 /100 | #313 | Tragic $34,942 |
| Apache | 0.0 /100 | #314 | Tragic $34,895 |
| Pennsylvania Germans | 0.0 /100 | #315 | Tragic $34,802 |
| Cherokee | 0.0 /100 | #316 | Tragic $34,742 |
| Potawatomi | 0.0 /100 | #317 | Tragic $34,739 |
Demographics Similar to Iroquois by Median Female Earnings
In terms of median female earnings, the demographic groups most similar to Iroquois are Immigrants from Caribbean ($36,414, a difference of 0.020%), U.S. Virgin Islander ($36,424, a difference of 0.050%), Spanish American ($36,391, a difference of 0.050%), Haitian ($36,374, a difference of 0.090%), and Marshallese ($36,459, a difference of 0.14%).
| Demographics | Rating | Rank | Median Female Earnings |
| Immigrants | Laos | 0.3 /100 | #273 | Tragic $36,841 |
| Immigrants | El Salvador | 0.2 /100 | #274 | Tragic $36,673 |
| Africans | 0.1 /100 | #275 | Tragic $36,530 |
| Central Americans | 0.1 /100 | #276 | Tragic $36,492 |
| Marshallese | 0.1 /100 | #277 | Tragic $36,459 |
| U.S. Virgin Islanders | 0.1 /100 | #278 | Tragic $36,424 |
| Immigrants | Caribbean | 0.1 /100 | #279 | Tragic $36,414 |
| Iroquois | 0.1 /100 | #280 | Tragic $36,408 |
| Spanish Americans | 0.1 /100 | #281 | Tragic $36,391 |
| Haitians | 0.1 /100 | #282 | Tragic $36,374 |
| Immigrants | Haiti | 0.1 /100 | #283 | Tragic $36,203 |
| Indonesians | 0.1 /100 | #284 | Tragic $36,140 |
| Paiute | 0.1 /100 | #285 | Tragic $36,056 |
| Osage | 0.0 /100 | #286 | Tragic $36,034 |
| Immigrants | Nicaragua | 0.0 /100 | #287 | Tragic $36,023 |