Chippewa vs Iraqi Median Female Earnings
COMPARE
Chippewa
Iraqi
Median Female Earnings
Median Female Earnings Comparison
Chippewa
Iraqis
$35,003
MEDIAN FEMALE EARNINGS
0.0/ 100
METRIC RATING
310th/ 347
METRIC RANK
$38,666
MEDIAN FEMALE EARNINGS
10.5/ 100
METRIC RATING
214th/ 347
METRIC RANK
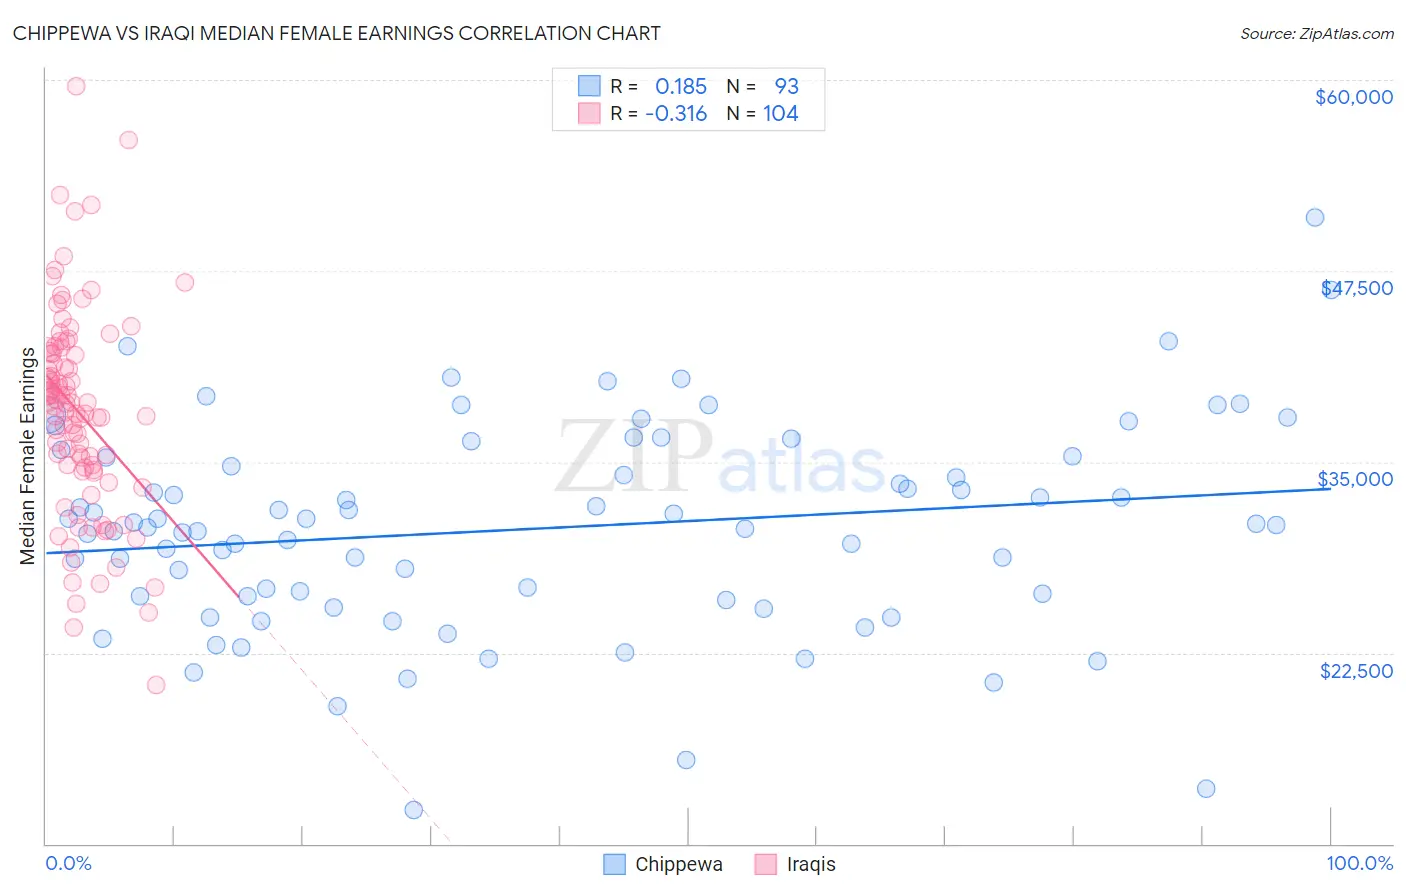
Chippewa vs Iraqi Median Female Earnings Correlation Chart
The statistical analysis conducted on geographies consisting of 214,968,178 people shows a poor positive correlation between the proportion of Chippewa and median female earnings in the United States with a correlation coefficient (R) of 0.185 and weighted average of $35,003. Similarly, the statistical analysis conducted on geographies consisting of 170,627,853 people shows a mild negative correlation between the proportion of Iraqis and median female earnings in the United States with a correlation coefficient (R) of -0.316 and weighted average of $38,666, a difference of 10.5%.
Median Female Earnings Correlation Summary
| Measurement | Chippewa | Iraqi |
| Minimum | $12,188 | $20,406 |
| Maximum | $50,958 | $59,566 |
| Range | $38,770 | $39,160 |
| Mean | $30,628 | $38,287 |
| Median | $30,893 | $38,841 |
| Interquartile 25% (IQ1) | $26,067 | $34,526 |
| Interquartile 75% (IQ3) | $35,324 | $42,153 |
| Interquartile Range (IQR) | $9,258 | $7,626 |
| Standard Deviation (Sample) | $6,851 | $6,723 |
| Standard Deviation (Population) | $6,814 | $6,691 |
Similar Demographics by Median Female Earnings
Demographics Similar to Chippewa by Median Female Earnings
In terms of median female earnings, the demographic groups most similar to Chippewa are Honduran ($35,013, a difference of 0.030%), Immigrants from Bahamas ($35,027, a difference of 0.070%), Ute ($34,960, a difference of 0.12%), Sioux ($35,063, a difference of 0.17%), and Yaqui ($34,943, a difference of 0.17%).
| Demographics | Rating | Rank | Median Female Earnings |
| Immigrants | Latin America | 0.0 /100 | #303 | Tragic $35,307 |
| Crow | 0.0 /100 | #304 | Tragic $35,266 |
| Bahamians | 0.0 /100 | #305 | Tragic $35,125 |
| Fijians | 0.0 /100 | #306 | Tragic $35,114 |
| Sioux | 0.0 /100 | #307 | Tragic $35,063 |
| Immigrants | Bahamas | 0.0 /100 | #308 | Tragic $35,027 |
| Hondurans | 0.0 /100 | #309 | Tragic $35,013 |
| Chippewa | 0.0 /100 | #310 | Tragic $35,003 |
| Ute | 0.0 /100 | #311 | Tragic $34,960 |
| Yaqui | 0.0 /100 | #312 | Tragic $34,943 |
| Cubans | 0.0 /100 | #313 | Tragic $34,942 |
| Apache | 0.0 /100 | #314 | Tragic $34,895 |
| Pennsylvania Germans | 0.0 /100 | #315 | Tragic $34,802 |
| Cherokee | 0.0 /100 | #316 | Tragic $34,742 |
| Potawatomi | 0.0 /100 | #317 | Tragic $34,739 |
Demographics Similar to Iraqis by Median Female Earnings
In terms of median female earnings, the demographic groups most similar to Iraqis are Jamaican ($38,670, a difference of 0.010%), Spaniard ($38,656, a difference of 0.020%), Immigrants from Ecuador ($38,644, a difference of 0.060%), Immigrants from Jamaica ($38,625, a difference of 0.11%), and Guamanian/Chamorro ($38,717, a difference of 0.13%).
| Demographics | Rating | Rank | Median Female Earnings |
| Immigrants | Cambodia | 14.2 /100 | #207 | Poor $38,833 |
| Immigrants | Thailand | 13.6 /100 | #208 | Poor $38,810 |
| Norwegians | 13.4 /100 | #209 | Poor $38,802 |
| Czechoslovakians | 12.0 /100 | #210 | Poor $38,738 |
| Aleuts | 11.6 /100 | #211 | Poor $38,719 |
| Guamanians/Chamorros | 11.5 /100 | #212 | Poor $38,717 |
| Jamaicans | 10.5 /100 | #213 | Poor $38,670 |
| Iraqis | 10.5 /100 | #214 | Poor $38,666 |
| Spaniards | 10.3 /100 | #215 | Poor $38,656 |
| Immigrants | Ecuador | 10.1 /100 | #216 | Poor $38,644 |
| Immigrants | Jamaica | 9.7 /100 | #217 | Tragic $38,625 |
| Cape Verdeans | 9.5 /100 | #218 | Tragic $38,614 |
| Nepalese | 9.3 /100 | #219 | Tragic $38,603 |
| Yugoslavians | 8.8 /100 | #220 | Tragic $38,573 |
| Immigrants | Azores | 8.8 /100 | #221 | Tragic $38,573 |