Chinese vs Immigrants from Hong Kong Householder Income Ages 45 - 64 years
COMPARE
Chinese
Immigrants from Hong Kong
Householder Income Ages 45 - 64 years
Householder Income Ages 45 - 64 years Comparison
Chinese
Immigrants from Hong Kong
$116,156
HOUSEHOLDER INCOME AGES 45 - 64 YEARS
100.0/ 100
METRIC RATING
33rd/ 347
METRIC RANK
$127,500
HOUSEHOLDER INCOME AGES 45 - 64 YEARS
100.0/ 100
METRIC RATING
7th/ 347
METRIC RANK
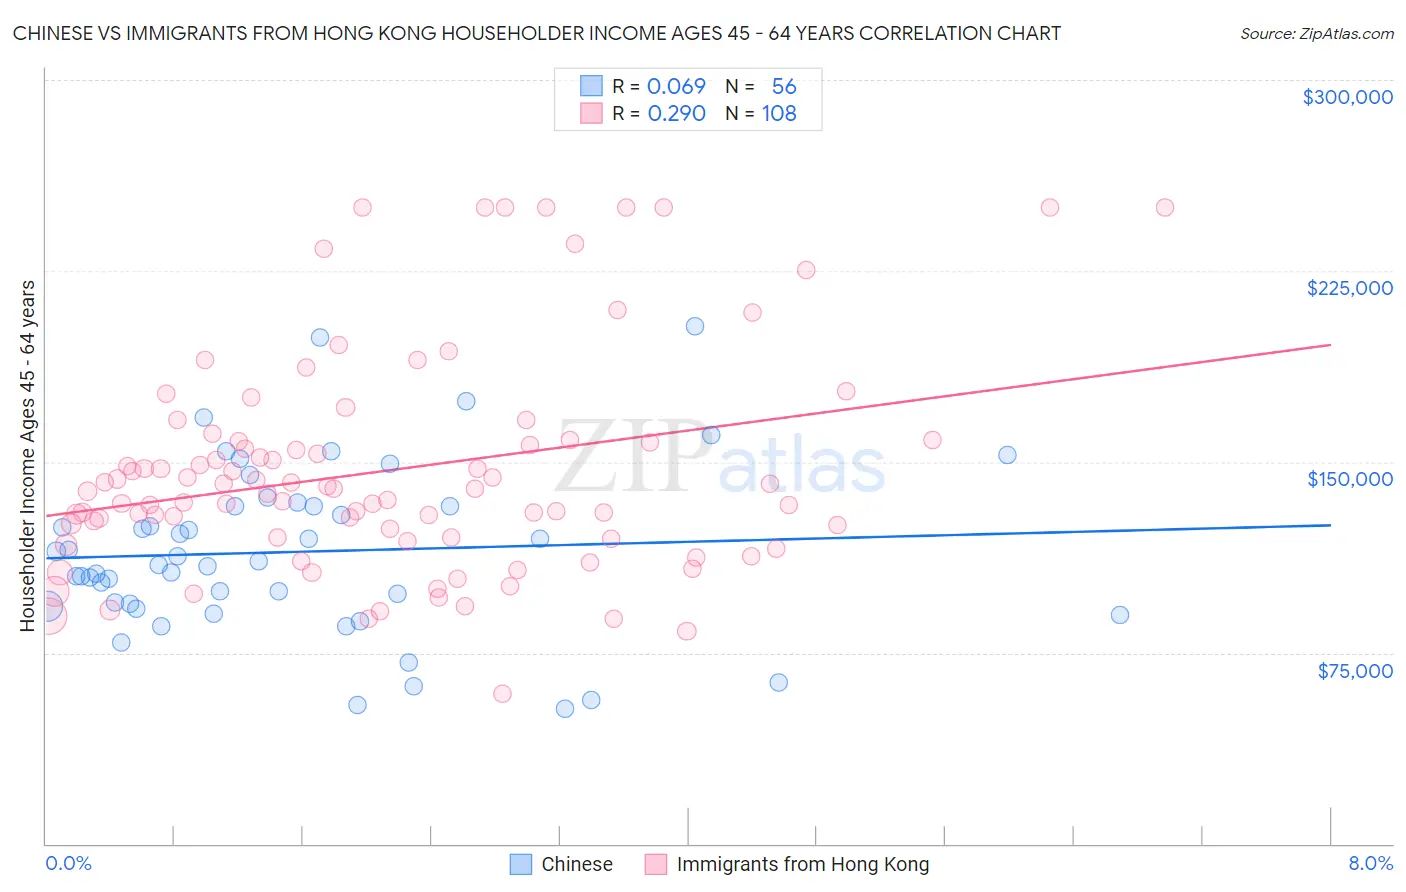
Chinese vs Immigrants from Hong Kong Householder Income Ages 45 - 64 years Correlation Chart
The statistical analysis conducted on geographies consisting of 64,773,263 people shows a slight positive correlation between the proportion of Chinese and household income with householder between the ages 45 and 64 in the United States with a correlation coefficient (R) of 0.069 and weighted average of $116,156. Similarly, the statistical analysis conducted on geographies consisting of 253,785,211 people shows a weak positive correlation between the proportion of Immigrants from Hong Kong and household income with householder between the ages 45 and 64 in the United States with a correlation coefficient (R) of 0.290 and weighted average of $127,500, a difference of 9.8%.
Householder Income Ages 45 - 64 years Correlation Summary
| Measurement | Chinese | Immigrants from Hong Kong |
| Minimum | $52,969 | $59,041 |
| Maximum | $203,211 | $250,001 |
| Range | $150,242 | $190,960 |
| Mean | $114,652 | $146,614 |
| Median | $110,020 | $138,796 |
| Interquartile 25% (IQ1) | $93,748 | $120,380 |
| Interquartile 75% (IQ3) | $132,670 | $158,248 |
| Interquartile Range (IQR) | $38,922 | $37,867 |
| Standard Deviation (Sample) | $33,042 | $42,909 |
| Standard Deviation (Population) | $32,746 | $42,710 |
Similar Demographics by Householder Income Ages 45 - 64 years
Demographics Similar to Chinese by Householder Income Ages 45 - 64 years
In terms of householder income ages 45 - 64 years, the demographic groups most similar to Chinese are Immigrants from Denmark ($116,000, a difference of 0.13%), Russian ($116,328, a difference of 0.15%), Latvian ($115,957, a difference of 0.17%), Immigrants from Switzerland ($115,934, a difference of 0.19%), and Immigrants from Asia ($116,566, a difference of 0.35%).
| Demographics | Rating | Rank | Householder Income Ages 45 - 64 years |
| Immigrants | Sweden | 100.0 /100 | #26 | Exceptional $118,318 |
| Immigrants | Northern Europe | 100.0 /100 | #27 | Exceptional $117,930 |
| Turks | 100.0 /100 | #28 | Exceptional $117,814 |
| Bhutanese | 100.0 /100 | #29 | Exceptional $117,750 |
| Immigrants | Bolivia | 100.0 /100 | #30 | Exceptional $117,731 |
| Immigrants | Asia | 100.0 /100 | #31 | Exceptional $116,566 |
| Russians | 100.0 /100 | #32 | Exceptional $116,328 |
| Chinese | 100.0 /100 | #33 | Exceptional $116,156 |
| Immigrants | Denmark | 100.0 /100 | #34 | Exceptional $116,000 |
| Latvians | 100.0 /100 | #35 | Exceptional $115,957 |
| Immigrants | Switzerland | 100.0 /100 | #36 | Exceptional $115,934 |
| Maltese | 99.9 /100 | #37 | Exceptional $114,754 |
| Immigrants | Pakistan | 99.9 /100 | #38 | Exceptional $114,434 |
| Immigrants | Turkey | 99.9 /100 | #39 | Exceptional $114,407 |
| Cambodians | 99.9 /100 | #40 | Exceptional $114,342 |
Demographics Similar to Immigrants from Hong Kong by Householder Income Ages 45 - 64 years
In terms of householder income ages 45 - 64 years, the demographic groups most similar to Immigrants from Hong Kong are Immigrants from Iran ($126,940, a difference of 0.44%), Iranian ($129,350, a difference of 1.5%), Immigrants from Singapore ($129,514, a difference of 1.6%), Thai ($129,560, a difference of 1.6%), and Okinawan ($124,796, a difference of 2.2%).
| Demographics | Rating | Rank | Householder Income Ages 45 - 64 years |
| Immigrants | Taiwan | 100.0 /100 | #1 | Exceptional $135,508 |
| Filipinos | 100.0 /100 | #2 | Exceptional $134,910 |
| Immigrants | India | 100.0 /100 | #3 | Exceptional $132,488 |
| Thais | 100.0 /100 | #4 | Exceptional $129,560 |
| Immigrants | Singapore | 100.0 /100 | #5 | Exceptional $129,514 |
| Iranians | 100.0 /100 | #6 | Exceptional $129,350 |
| Immigrants | Hong Kong | 100.0 /100 | #7 | Exceptional $127,500 |
| Immigrants | Iran | 100.0 /100 | #8 | Exceptional $126,940 |
| Okinawans | 100.0 /100 | #9 | Exceptional $124,796 |
| Immigrants | South Central Asia | 100.0 /100 | #10 | Exceptional $124,188 |
| Cypriots | 100.0 /100 | #11 | Exceptional $123,396 |
| Immigrants | Israel | 100.0 /100 | #12 | Exceptional $122,893 |
| Immigrants | Ireland | 100.0 /100 | #13 | Exceptional $122,757 |
| Indians (Asian) | 100.0 /100 | #14 | Exceptional $122,343 |
| Immigrants | Eastern Asia | 100.0 /100 | #15 | Exceptional $122,222 |