Chickasaw vs Immigrants from Korea Wage/Income Gap
COMPARE
Chickasaw
Immigrants from Korea
Wage/Income Gap
Wage/Income Gap Comparison
Chickasaw
Immigrants from Korea
27.2%
WAGE/INCOME GAP
3.5/ 100
METRIC RATING
244th/ 347
METRIC RANK
27.8%
WAGE/INCOME GAP
0.8/ 100
METRIC RATING
272nd/ 347
METRIC RANK
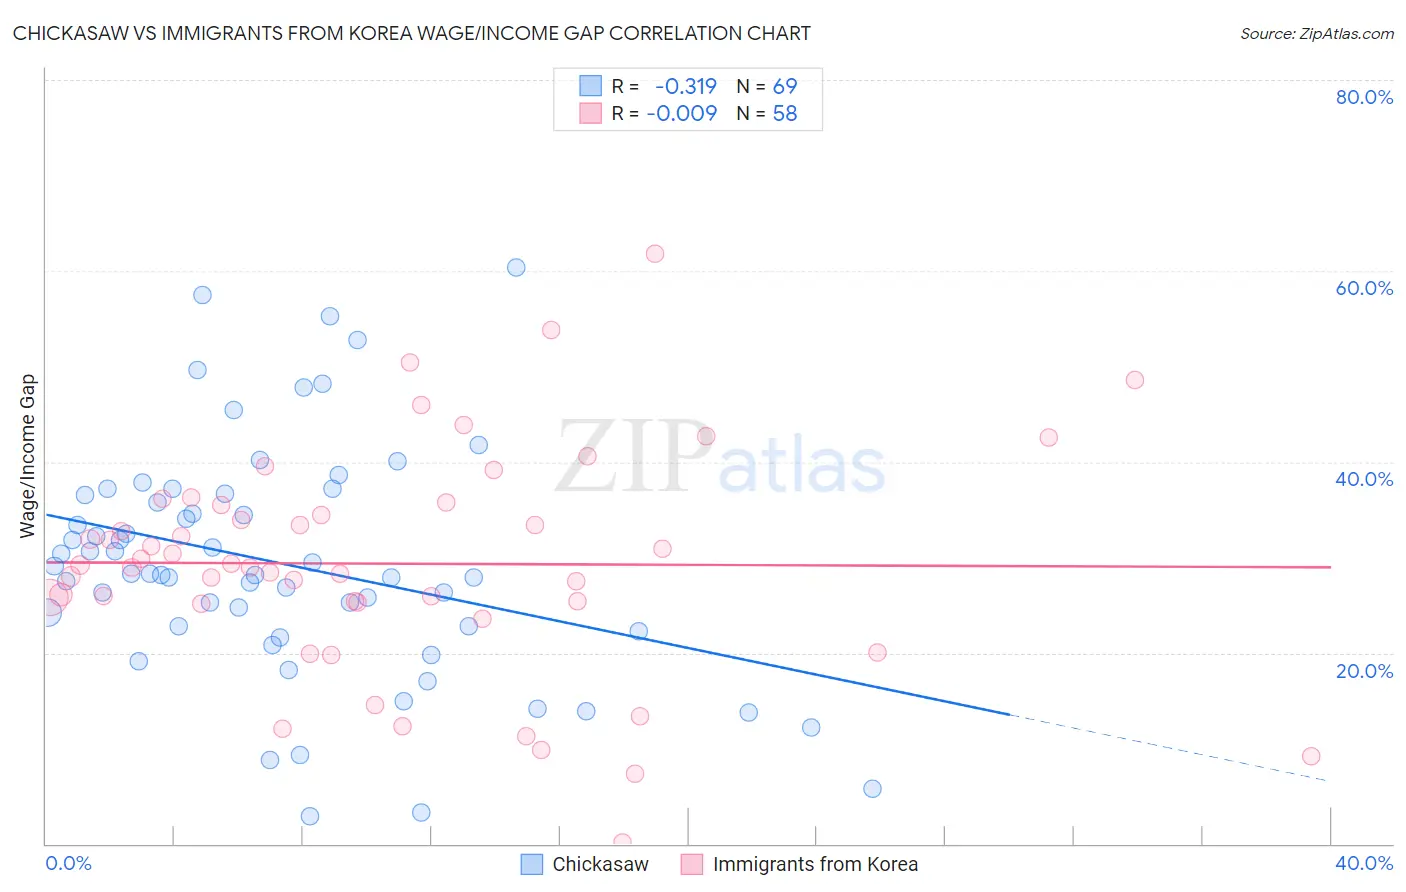
Chickasaw vs Immigrants from Korea Wage/Income Gap Correlation Chart
The statistical analysis conducted on geographies consisting of 147,661,645 people shows a mild negative correlation between the proportion of Chickasaw and wage/income gap percentage in the United States with a correlation coefficient (R) of -0.319 and weighted average of 27.2%. Similarly, the statistical analysis conducted on geographies consisting of 416,007,882 people shows no correlation between the proportion of Immigrants from Korea and wage/income gap percentage in the United States with a correlation coefficient (R) of -0.009 and weighted average of 27.8%, a difference of 2.3%.
Wage/Income Gap Correlation Summary
| Measurement | Chickasaw | Immigrants from Korea |
| Minimum | 2.8% | 0.13% |
| Maximum | 60.4% | 61.8% |
| Range | 57.6% | 61.7% |
| Mean | 29.3% | 29.3% |
| Median | 28.3% | 29.1% |
| Interquartile 25% (IQ1) | 22.5% | 25.3% |
| Interquartile 75% (IQ3) | 36.6% | 35.5% |
| Interquartile Range (IQR) | 14.2% | 10.2% |
| Standard Deviation (Sample) | 12.2% | 11.7% |
| Standard Deviation (Population) | 12.2% | 11.6% |
Similar Demographics by Wage/Income Gap
Demographics Similar to Chickasaw by Wage/Income Gap
In terms of wage/income gap, the demographic groups most similar to Chickasaw are Immigrants from the Azores (27.2%, a difference of 0.020%), Spanish (27.1%, a difference of 0.070%), Immigrants from Sri Lanka (27.1%, a difference of 0.080%), Nonimmigrants (27.2%, a difference of 0.090%), and Creek (27.1%, a difference of 0.13%).
| Demographics | Rating | Rank | Wage/Income Gap |
| Immigrants | Eastern Asia | 4.4 /100 | #237 | Tragic 27.1% |
| Osage | 4.4 /100 | #238 | Tragic 27.1% |
| Estonians | 4.3 /100 | #239 | Tragic 27.1% |
| Immigrants | Europe | 3.8 /100 | #240 | Tragic 27.1% |
| Creek | 3.8 /100 | #241 | Tragic 27.1% |
| Immigrants | Sri Lanka | 3.7 /100 | #242 | Tragic 27.1% |
| Spanish | 3.6 /100 | #243 | Tragic 27.1% |
| Chickasaw | 3.5 /100 | #244 | Tragic 27.2% |
| Immigrants | Azores | 3.5 /100 | #245 | Tragic 27.2% |
| Immigrants | Nonimmigrants | 3.3 /100 | #246 | Tragic 27.2% |
| Celtics | 2.8 /100 | #247 | Tragic 27.3% |
| Cypriots | 2.8 /100 | #248 | Tragic 27.3% |
| Carpatho Rusyns | 2.7 /100 | #249 | Tragic 27.3% |
| Immigrants | Czechoslovakia | 2.7 /100 | #250 | Tragic 27.3% |
| Immigrants | Norway | 2.5 /100 | #251 | Tragic 27.3% |
Demographics Similar to Immigrants from Korea by Wage/Income Gap
In terms of wage/income gap, the demographic groups most similar to Immigrants from Korea are Ute (27.8%, a difference of 0.070%), Bulgarian (27.8%, a difference of 0.11%), Immigrants from Western Europe (27.8%, a difference of 0.15%), American (27.8%, a difference of 0.15%), and Immigrants from Japan (27.9%, a difference of 0.23%).
| Demographics | Rating | Rank | Wage/Income Gap |
| Serbians | 1.0 /100 | #265 | Tragic 27.7% |
| Hmong | 1.0 /100 | #266 | Tragic 27.7% |
| Turks | 1.0 /100 | #267 | Tragic 27.7% |
| New Zealanders | 1.0 /100 | #268 | Tragic 27.7% |
| Potawatomi | 0.9 /100 | #269 | Tragic 27.7% |
| Immigrants | Western Europe | 0.9 /100 | #270 | Tragic 27.8% |
| Ute | 0.8 /100 | #271 | Tragic 27.8% |
| Immigrants | Korea | 0.8 /100 | #272 | Tragic 27.8% |
| Bulgarians | 0.7 /100 | #273 | Tragic 27.8% |
| Americans | 0.7 /100 | #274 | Tragic 27.8% |
| Immigrants | Japan | 0.7 /100 | #275 | Tragic 27.9% |
| Lebanese | 0.7 /100 | #276 | Tragic 27.9% |
| Latvians | 0.7 /100 | #277 | Tragic 27.9% |
| Immigrants | England | 0.6 /100 | #278 | Tragic 27.9% |
| Romanians | 0.5 /100 | #279 | Tragic 28.0% |