Mongolian vs Immigrants from Korea Wage/Income Gap
COMPARE
Mongolian
Immigrants from Korea
Wage/Income Gap
Wage/Income Gap Comparison
Mongolians
Immigrants from Korea
26.6%
WAGE/INCOME GAP
11.4/ 100
METRIC RATING
211th/ 347
METRIC RANK
27.8%
WAGE/INCOME GAP
0.8/ 100
METRIC RATING
272nd/ 347
METRIC RANK
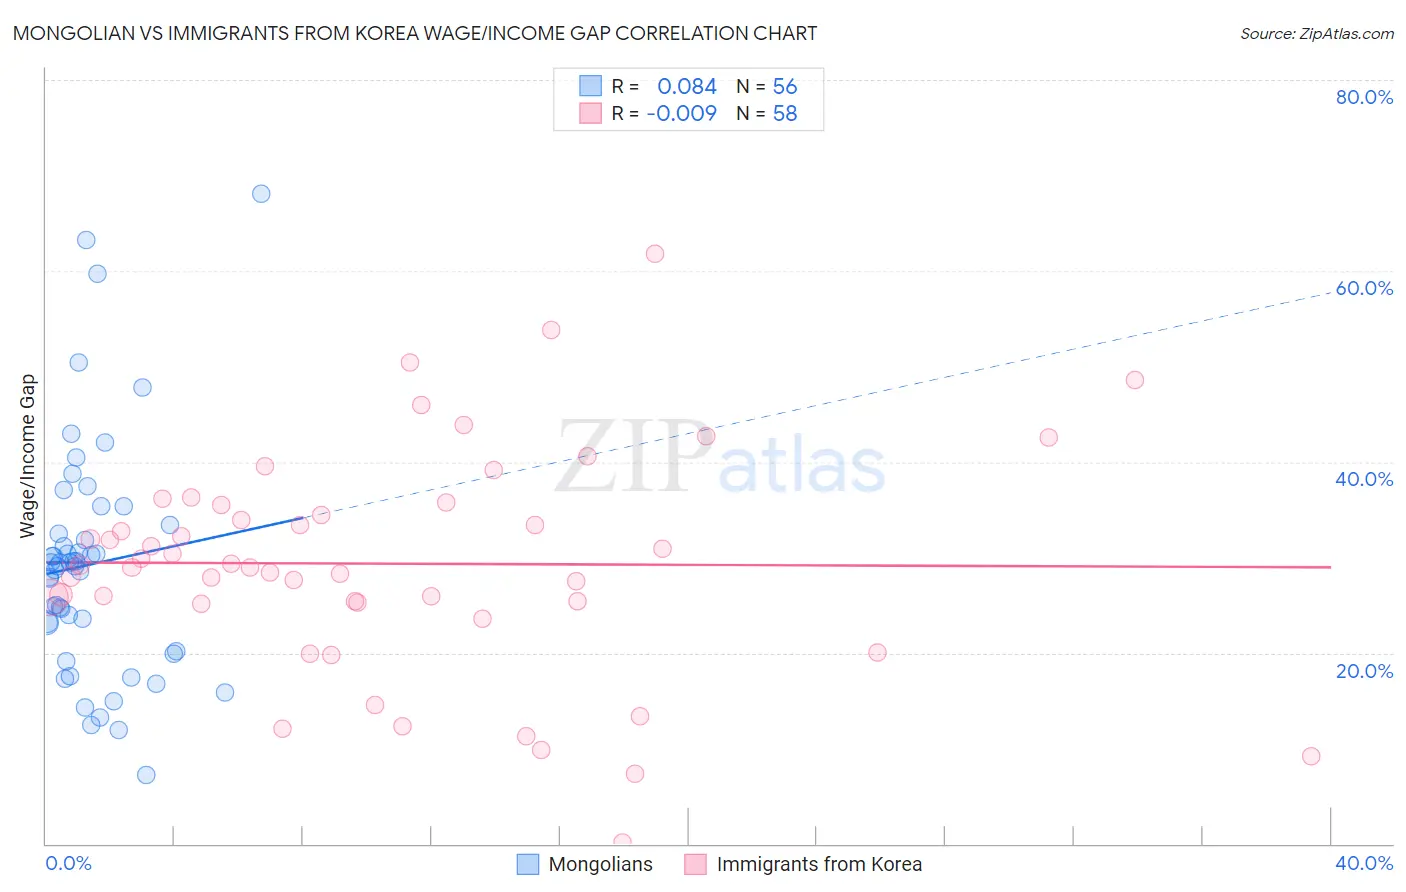
Mongolian vs Immigrants from Korea Wage/Income Gap Correlation Chart
The statistical analysis conducted on geographies consisting of 140,332,926 people shows a slight positive correlation between the proportion of Mongolians and wage/income gap percentage in the United States with a correlation coefficient (R) of 0.084 and weighted average of 26.6%. Similarly, the statistical analysis conducted on geographies consisting of 416,007,882 people shows no correlation between the proportion of Immigrants from Korea and wage/income gap percentage in the United States with a correlation coefficient (R) of -0.009 and weighted average of 27.8%, a difference of 4.4%.
Wage/Income Gap Correlation Summary
| Measurement | Mongolian | Immigrants from Korea |
| Minimum | 7.3% | 0.13% |
| Maximum | 68.0% | 61.8% |
| Range | 60.8% | 61.7% |
| Mean | 29.3% | 29.3% |
| Median | 29.2% | 29.1% |
| Interquartile 25% (IQ1) | 21.7% | 25.3% |
| Interquartile 75% (IQ3) | 32.9% | 35.5% |
| Interquartile Range (IQR) | 11.2% | 10.2% |
| Standard Deviation (Sample) | 12.2% | 11.7% |
| Standard Deviation (Population) | 12.1% | 11.6% |
Similar Demographics by Wage/Income Gap
Demographics Similar to Mongolians by Wage/Income Gap
In terms of wage/income gap, the demographic groups most similar to Mongolians are Iraqi (26.6%, a difference of 0.030%), Arab (26.6%, a difference of 0.13%), Immigrants from Kuwait (26.6%, a difference of 0.17%), Immigrants from Iraq (26.7%, a difference of 0.18%), and Egyptian (26.6%, a difference of 0.19%).
| Demographics | Rating | Rank | Wage/Income Gap |
| Immigrants | Russia | 19.0 /100 | #204 | Poor 26.4% |
| Immigrants | Southern Europe | 17.3 /100 | #205 | Poor 26.4% |
| Indians (Asian) | 16.5 /100 | #206 | Poor 26.4% |
| Immigrants | Italy | 15.8 /100 | #207 | Poor 26.5% |
| Egyptians | 12.7 /100 | #208 | Poor 26.6% |
| Immigrants | Kuwait | 12.6 /100 | #209 | Poor 26.6% |
| Arabs | 12.3 /100 | #210 | Poor 26.6% |
| Mongolians | 11.4 /100 | #211 | Poor 26.6% |
| Iraqis | 11.2 /100 | #212 | Poor 26.6% |
| Immigrants | Iraq | 10.3 /100 | #213 | Poor 26.7% |
| Immigrants | China | 10.3 /100 | #214 | Poor 26.7% |
| Yugoslavians | 9.7 /100 | #215 | Tragic 26.7% |
| Immigrants | Portugal | 9.5 /100 | #216 | Tragic 26.7% |
| Brazilians | 9.2 /100 | #217 | Tragic 26.7% |
| Immigrants | Saudi Arabia | 9.1 /100 | #218 | Tragic 26.7% |
Demographics Similar to Immigrants from Korea by Wage/Income Gap
In terms of wage/income gap, the demographic groups most similar to Immigrants from Korea are Ute (27.8%, a difference of 0.070%), Bulgarian (27.8%, a difference of 0.11%), Immigrants from Western Europe (27.8%, a difference of 0.15%), American (27.8%, a difference of 0.15%), and Immigrants from Japan (27.9%, a difference of 0.23%).
| Demographics | Rating | Rank | Wage/Income Gap |
| Serbians | 1.0 /100 | #265 | Tragic 27.7% |
| Hmong | 1.0 /100 | #266 | Tragic 27.7% |
| Turks | 1.0 /100 | #267 | Tragic 27.7% |
| New Zealanders | 1.0 /100 | #268 | Tragic 27.7% |
| Potawatomi | 0.9 /100 | #269 | Tragic 27.7% |
| Immigrants | Western Europe | 0.9 /100 | #270 | Tragic 27.8% |
| Ute | 0.8 /100 | #271 | Tragic 27.8% |
| Immigrants | Korea | 0.8 /100 | #272 | Tragic 27.8% |
| Bulgarians | 0.7 /100 | #273 | Tragic 27.8% |
| Americans | 0.7 /100 | #274 | Tragic 27.8% |
| Immigrants | Japan | 0.7 /100 | #275 | Tragic 27.9% |
| Lebanese | 0.7 /100 | #276 | Tragic 27.9% |
| Latvians | 0.7 /100 | #277 | Tragic 27.9% |
| Immigrants | England | 0.6 /100 | #278 | Tragic 27.9% |
| Romanians | 0.5 /100 | #279 | Tragic 28.0% |