Chickasaw vs Immigrants from Korea Unemployment

COMPARE

Chickasaw
Race
Ancestry
AfghanAfricanAlaska NativeAlaskan AthabascanAlbanianAleutAlsatianAmericanApacheArabArapahoArgentineanArmenianAssyrian/Chaldean/SyriacAustralianAustrianBahamianBangladeshiBarbadianBasqueBelgianBelizeanBermudanBhutaneseBlackfeetBolivianBrazilianBritishBritish West IndianBulgarianBurmeseCajunCambodianCanadianCape VerdeanCarpatho RusynCelticCentral AmericanCentral American IndianCherokeeCheyenneChickasawChileanChineseChippewaChoctawColombianColvilleComancheCosta RicanCreeCreekCroatianCrowCubanCypriotCzechCzechoslovakianDanishDelawareDominicanDutchDutch West IndianEastern EuropeanEcuadorianEgyptianEnglishEstonianEthiopianEuropeanFijianFilipinoFinnishFrenchFrench American IndianFrench CanadianGermanGerman RussianGhanaianGreekGuamanian/ChamorroGuatemalanGuyaneseHaitianHmongHonduranHopiHoumaHungarianIcelanderIndian (Asian)IndonesianInupiatIranianIraqiIrishIroquoisIsraeliItalianJamaicanJapaneseJordanianKenyanKiowaKoreanLaotianLatvianLebaneseLiberianLithuanianLumbeeLuxembourgerMacedonianMalaysianMalteseMarshalleseMenomineeMexicanMexican American IndianMongolianMoroccanNative HawaiianNavajoNepaleseNew ZealanderNicaraguanNigerianNorthern EuropeanNorwegianOkinawanOsageOttawaPaiutePakistaniPalestinianPanamanianParaguayanPennsylvania GermanPeruvianPimaPolishPortuguesePotawatomiPuebloPuerto RicanPuget Sound SalishRomanianRussianSalvadoranSamoanScandinavianScotch-IrishScottishSeminoleSenegaleseSerbianShoshoneSierra LeoneanSiouxSlavicSlovakSloveneSomaliSouth AfricanSouth AmericanSouth American IndianSoviet UnionSpaniardSpanishSpanish AmericanSpanish American IndianSri LankanSubsaharan AfricanSudaneseSwedishSwissSyrianTaiwaneseThaiTlingit-HaidaTohono O'OdhamTonganTrinidadian and TobagonianTsimshianTurkishU.S. Virgin IslanderUgandanUkrainianUruguayanUteVenezuelanVietnameseWelshWest IndianYakamaYaquiYugoslavianYumanYup'ikZimbabwean
Immigration
NonimmigrantsImmigrantsAfghanistanAfricaAlbaniaArgentinaArmeniaAsiaAustraliaAustriaBahamasBangladeshBarbadosBelarusBelgiumBelizeBoliviaBosnia and HerzegovinaBrazilBulgariaBurma/MyanmarCabo VerdeCambodiaCameroonCanadaCaribbeanCentral AmericaChileChinaColombiaCongoCosta RicaCroatiaCubaCzechoslovakiaDenmarkDominicaDominican RepublicEastern AfricaEastern AsiaEastern EuropeEcuadorEgyptEl SalvadorEnglandEritreaEthiopiaEuropeFijiFranceGermanyGhanaGreeceGrenadaGuatemalaGuyanaHaitiHondurasHong KongHungaryIndiaIndonesiaIranIraqIrelandIsraelItalyJamaicaJapanJordanKazakhstanKenyaKuwaitLaosLatin AmericaLatviaLebanonLiberiaLithuaniaMalaysiaMexicoMicronesiaMiddle AfricaMoldovaMoroccoNepalNetherlandsNicaraguaNigeriaNorth AmericaNorth MacedoniaNorthern AfricaNorthern EuropeNorwayOceaniaPakistanPanamaPeruPhilippinesPolandPortugalRomaniaRussiaSaudi ArabiaScotlandSenegalSerbiaSierra LeoneSingaporeSomaliaSouth AfricaSouth AmericaSouth Central AsiaSouth Eastern AsiaSouthern EuropeSpainSri LankaSt. Vincent and the GrenadinesSudanSwedenSwitzerlandSyriaTaiwanThailandTrinidad and TobagoTurkeyUgandaUkraineUruguayUzbekistanVenezuelaVietnamWest IndiesWestern AfricaWestern AsiaWestern EuropeYemenZaireZimbabweAzores
Immigrants from Korea
Race
Ancestry
AfghanAfricanAlaska NativeAlaskan AthabascanAlbanianAleutAlsatianAmericanApacheArabArapahoArgentineanArmenianAssyrian/Chaldean/SyriacAustralianAustrianBahamianBangladeshiBarbadianBasqueBelgianBelizeanBermudanBhutaneseBlackfeetBolivianBrazilianBritishBritish West IndianBulgarianBurmeseCajunCambodianCanadianCape VerdeanCarpatho RusynCelticCentral AmericanCentral American IndianCherokeeCheyenneChileanChineseChippewaChoctawColombianColvilleComancheCosta RicanCreeCreekCroatianCrowCubanCypriotCzechCzechoslovakianDanishDelawareDominicanDutchDutch West IndianEastern EuropeanEcuadorianEgyptianEnglishEstonianEthiopianEuropeanFijianFilipinoFinnishFrenchFrench American IndianFrench CanadianGermanGerman RussianGhanaianGreekGuamanian/ChamorroGuatemalanGuyaneseHaitianHmongHonduranHopiHoumaHungarianIcelanderIndian (Asian)IndonesianInupiatIranianIraqiIrishIroquoisIsraeliItalianJamaicanJapaneseJordanianKenyanKiowaKoreanLaotianLatvianLebaneseLiberianLithuanianLumbeeLuxembourgerMacedonianMalaysianMalteseMarshalleseMenomineeMexicanMexican American IndianMongolianMoroccanNative HawaiianNavajoNepaleseNew ZealanderNicaraguanNigerianNorthern EuropeanNorwegianOkinawanOsageOttawaPaiutePakistaniPalestinianPanamanianParaguayanPennsylvania GermanPeruvianPimaPolishPortuguesePotawatomiPuebloPuerto RicanPuget Sound SalishRomanianRussianSalvadoranSamoanScandinavianScotch-IrishScottishSeminoleSenegaleseSerbianShoshoneSierra LeoneanSiouxSlavicSlovakSloveneSomaliSouth AfricanSouth AmericanSouth American IndianSoviet UnionSpaniardSpanishSpanish AmericanSpanish American IndianSri LankanSubsaharan AfricanSudaneseSwedishSwissSyrianTaiwaneseThaiTlingit-HaidaTohono O'OdhamTonganTrinidadian and TobagonianTsimshianTurkishU.S. Virgin IslanderUgandanUkrainianUruguayanUteVenezuelanVietnameseWelshWest IndianYakamaYaquiYugoslavianYumanYup'ikZimbabwean
Immigration
NonimmigrantsImmigrantsAfghanistanAfricaAlbaniaArgentinaArmeniaAsiaAustraliaAustriaBahamasBangladeshBarbadosBelarusBelgiumBelizeBoliviaBosnia and HerzegovinaBrazilBulgariaBurma/MyanmarCabo VerdeCambodiaCameroonCanadaCaribbeanCentral AmericaChileChinaColombiaCongoCosta RicaCroatiaCubaCzechoslovakiaDenmarkDominicaDominican RepublicEastern AfricaEastern AsiaEastern EuropeEcuadorEgyptEl SalvadorEnglandEritreaEthiopiaEuropeFijiFranceGermanyGhanaGreeceGrenadaGuatemalaGuyanaHaitiHondurasHong KongHungaryIndiaIndonesiaIranIraqIrelandIsraelItalyJamaicaJapanJordanKazakhstanKenyaKoreaKuwaitLaosLatin AmericaLatviaLebanonLiberiaLithuaniaMalaysiaMexicoMicronesiaMiddle AfricaMoldovaMoroccoNepalNetherlandsNicaraguaNigeriaNorth AmericaNorth MacedoniaNorthern AfricaNorthern EuropeNorwayOceaniaPakistanPanamaPeruPhilippinesPolandPortugalRomaniaRussiaSaudi ArabiaScotlandSenegalSerbiaSierra LeoneSingaporeSomaliaSouth AfricaSouth AmericaSouth Central AsiaSouth Eastern AsiaSouthern EuropeSpainSri LankaSt. Vincent and the GrenadinesSudanSwedenSwitzerlandSyriaTaiwanThailandTrinidad and TobagoTurkeyUgandaUkraineUruguayUzbekistanVenezuelaVietnamWest IndiesWestern AfricaWestern AsiaWestern EuropeYemenZaireZimbabweAzores
Unemployment
Income
Poverty
Unemployment
Labor Participation
Family Structure
Vehicle Availability
Education Level
Disability

Unemployment Comparison

Chickasaw

Immigrants from Korea

Exceptional
Exceptional
5.0%
UNEMPLOYMENT
94.0/ 100
METRIC RATING
103rd/ 347
METRIC RANK
5.0%
UNEMPLOYMENT
96.6/ 100
METRIC RATING
88th/ 347
METRIC RANK

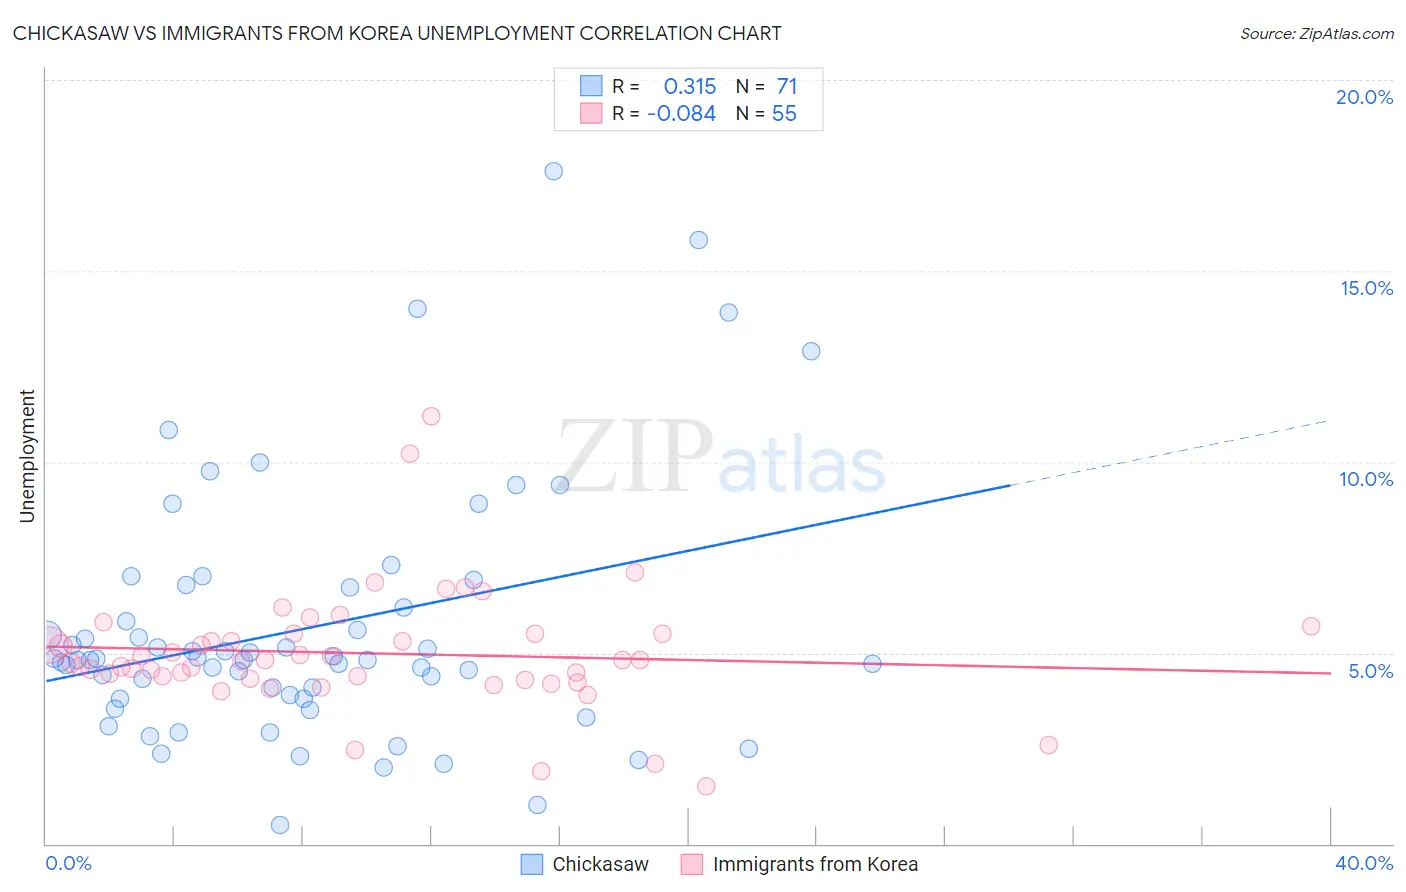
Chickasaw vs Immigrants from Korea Unemployment Correlation Chart

The statistical analysis conducted on geographies consisting of 147,562,181 people shows a mild positive correlation between the proportion of Chickasaw and unemployment in the United States with a correlation coefficient (R) of 0.315 and weighted average of 5.0%. Similarly, the statistical analysis conducted on geographies consisting of 415,935,417 people shows a slight negative correlation between the proportion of Immigrants from Korea and unemployment in the United States with a correlation coefficient (R) of -0.084 and weighted average of 5.0%, a difference of 0.96%.
Chickasaw vs Immigrants from Korea Unemployment

Unemployment Correlation Summary

MeasurementChickasawImmigrants from Korea
Minimum0.50%1.5%
Maximum17.6%11.2%
Range17.1%9.7%
Mean5.6%5.0%
Median4.8%4.8%
Interquartile 25% (IQ1)3.8%4.3%
Interquartile 75% (IQ3)6.7%5.5%
Interquartile Range (IQR)2.9%1.2%
Standard Deviation (Sample)3.3%1.6%
Standard Deviation (Population)3.3%1.6%

Demographics Similar to Chickasaw and Immigrants from Korea by Unemployment

In terms of unemployment, the demographic groups most similar to Chickasaw are Osage (5.0%, a difference of 0.0%), Maltese (5.0%, a difference of 0.0%), Immigrants from Argentina (5.0%, a difference of 0.040%), American (5.0%, a difference of 0.080%), and Estonian (5.0%, a difference of 0.18%). Similarly, the demographic groups most similar to Immigrants from Korea are Immigrants from Moldova (5.0%, a difference of 0.030%), Jordanian (5.0%, a difference of 0.090%), Immigrants from North Macedonia (5.0%, a difference of 0.13%), Immigrants from Sudan (5.0%, a difference of 0.14%), and Immigrants from South Africa (5.0%, a difference of 0.16%).
DemographicsRating | RankUnemployment
Immigrants | Australia
97.0
/100
|
#85
Exceptional
5.0%
Hungarians
96.9
/100
|
#86
Exceptional
5.0%
Immigrants | Moldova
96.6
/100
|
#87
Exceptional
5.0%
Immigrants | Korea
96.6
/100
|
#88
Exceptional
5.0%
Jordanians
96.4
/100
|
#89
Exceptional
5.0%
Immigrants | North Macedonia
96.3
/100
|
#90
Exceptional
5.0%
Immigrants | Sudan
96.3
/100
|
#91
Exceptional
5.0%
Immigrants | South Africa
96.2
/100
|
#92
Exceptional
5.0%
Ukrainians
96.0
/100
|
#93
Exceptional
5.0%
Immigrants | Austria
95.9
/100
|
#94
Exceptional
5.0%
Immigrants | Serbia
95.6
/100
|
#95
Exceptional
5.0%
Immigrants | England
95.2
/100
|
#96
Exceptional
5.0%
Immigrants | Czechoslovakia
95.1
/100
|
#97
Exceptional
5.0%
Romanians
95.0
/100
|
#98
Exceptional
5.0%
Mongolians
94.8
/100
|
#99
Exceptional
5.0%
Estonians
94.6
/100
|
#100
Exceptional
5.0%
Americans
94.3
/100
|
#101
Exceptional
5.0%
Immigrants | Argentina
94.1
/100
|
#102
Exceptional
5.0%
Chickasaw
94.0
/100
|
#103
Exceptional
5.0%
Osage
94.0
/100
|
#104
Exceptional
5.0%
Maltese
94.0
/100
|
#105
Exceptional
5.0%