Chickasaw vs Immigrants from Argentina Wage/Income Gap
COMPARE
Chickasaw
Immigrants from Argentina
Wage/Income Gap
Wage/Income Gap Comparison
Chickasaw
Immigrants from Argentina
27.2%
WAGE/INCOME GAP
3.5/ 100
METRIC RATING
244th/ 347
METRIC RANK
26.8%
WAGE/INCOME GAP
7.2/ 100
METRIC RATING
224th/ 347
METRIC RANK
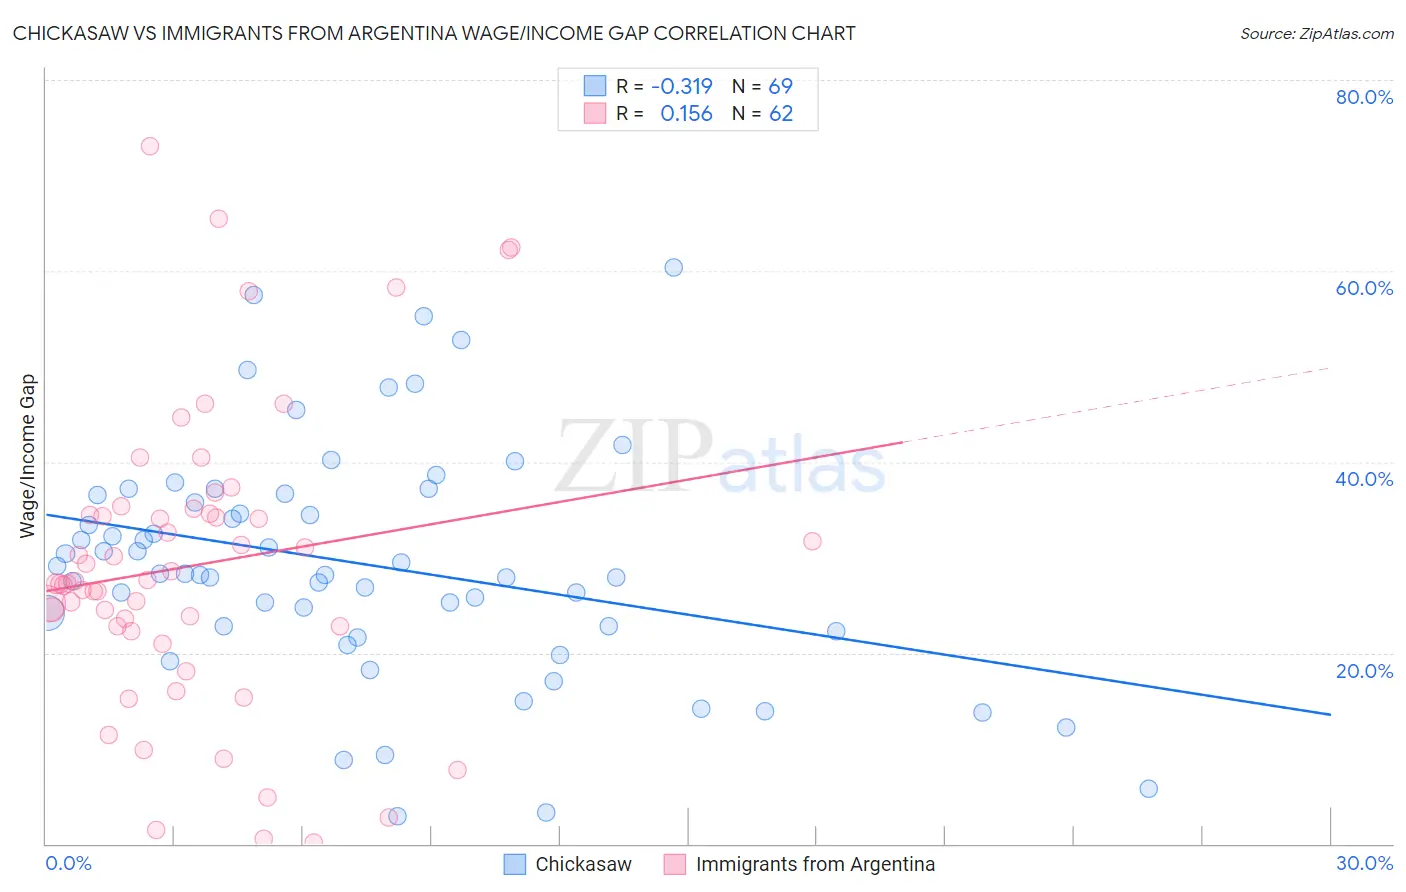
Chickasaw vs Immigrants from Argentina Wage/Income Gap Correlation Chart
The statistical analysis conducted on geographies consisting of 147,661,645 people shows a mild negative correlation between the proportion of Chickasaw and wage/income gap percentage in the United States with a correlation coefficient (R) of -0.319 and weighted average of 27.2%. Similarly, the statistical analysis conducted on geographies consisting of 264,345,547 people shows a poor positive correlation between the proportion of Immigrants from Argentina and wage/income gap percentage in the United States with a correlation coefficient (R) of 0.156 and weighted average of 26.8%, a difference of 1.2%.
Wage/Income Gap Correlation Summary
| Measurement | Chickasaw | Immigrants from Argentina |
| Minimum | 2.8% | 0.074% |
| Maximum | 60.4% | 73.0% |
| Range | 57.6% | 73.0% |
| Mean | 29.3% | 29.2% |
| Median | 28.3% | 27.4% |
| Interquartile 25% (IQ1) | 22.5% | 22.7% |
| Interquartile 75% (IQ3) | 36.6% | 34.6% |
| Interquartile Range (IQR) | 14.2% | 11.9% |
| Standard Deviation (Sample) | 12.2% | 15.6% |
| Standard Deviation (Population) | 12.2% | 15.5% |
Demographics Similar to Chickasaw and Immigrants from Argentina by Wage/Income Gap
In terms of wage/income gap, the demographic groups most similar to Chickasaw are Spanish (27.1%, a difference of 0.070%), Immigrants from Sri Lanka (27.1%, a difference of 0.080%), Creek (27.1%, a difference of 0.13%), Immigrants from Europe (27.1%, a difference of 0.15%), and Estonian (27.1%, a difference of 0.33%). Similarly, the demographic groups most similar to Immigrants from Argentina are Immigrants from Ireland (26.9%, a difference of 0.17%), Asian (26.9%, a difference of 0.33%), Spaniard (27.0%, a difference of 0.41%), Immigrants from Turkey (27.0%, a difference of 0.41%), and Immigrants from Asia (27.0%, a difference of 0.45%).
| Demographics | Rating | Rank | Wage/Income Gap |
| Immigrants | Argentina | 7.2 /100 | #224 | Tragic 26.8% |
| Immigrants | Ireland | 6.5 /100 | #225 | Tragic 26.9% |
| Asians | 5.9 /100 | #226 | Tragic 26.9% |
| Spaniards | 5.6 /100 | #227 | Tragic 27.0% |
| Immigrants | Turkey | 5.6 /100 | #228 | Tragic 27.0% |
| Immigrants | Asia | 5.5 /100 | #229 | Tragic 27.0% |
| Ottawa | 5.3 /100 | #230 | Tragic 27.0% |
| Bhutanese | 5.3 /100 | #231 | Tragic 27.0% |
| Argentineans | 5.2 /100 | #232 | Tragic 27.0% |
| Immigrants | Brazil | 5.0 /100 | #233 | Tragic 27.0% |
| Immigrants | Pakistan | 4.9 /100 | #234 | Tragic 27.0% |
| Immigrants | Hungary | 4.8 /100 | #235 | Tragic 27.0% |
| Immigrants | Romania | 4.8 /100 | #236 | Tragic 27.0% |
| Immigrants | Eastern Asia | 4.4 /100 | #237 | Tragic 27.1% |
| Osage | 4.4 /100 | #238 | Tragic 27.1% |
| Estonians | 4.3 /100 | #239 | Tragic 27.1% |
| Immigrants | Europe | 3.8 /100 | #240 | Tragic 27.1% |
| Creek | 3.8 /100 | #241 | Tragic 27.1% |
| Immigrants | Sri Lanka | 3.7 /100 | #242 | Tragic 27.1% |
| Spanish | 3.6 /100 | #243 | Tragic 27.1% |
| Chickasaw | 3.5 /100 | #244 | Tragic 27.2% |