Chickasaw vs Immigrants from Korea 4 or more Vehicles in Household
COMPARE
Chickasaw
Immigrants from Korea
4 or more Vehicles in Household
4 or more Vehicles in Household Comparison
Chickasaw
Immigrants from Korea
7.4%
4 OR MORE VEHICLES IN HOUSEHOLD
99.9/ 100
METRIC RATING
71st/ 347
METRIC RANK
6.8%
4 OR MORE VEHICLES IN HOUSEHOLD
93.8/ 100
METRIC RATING
127th/ 347
METRIC RANK
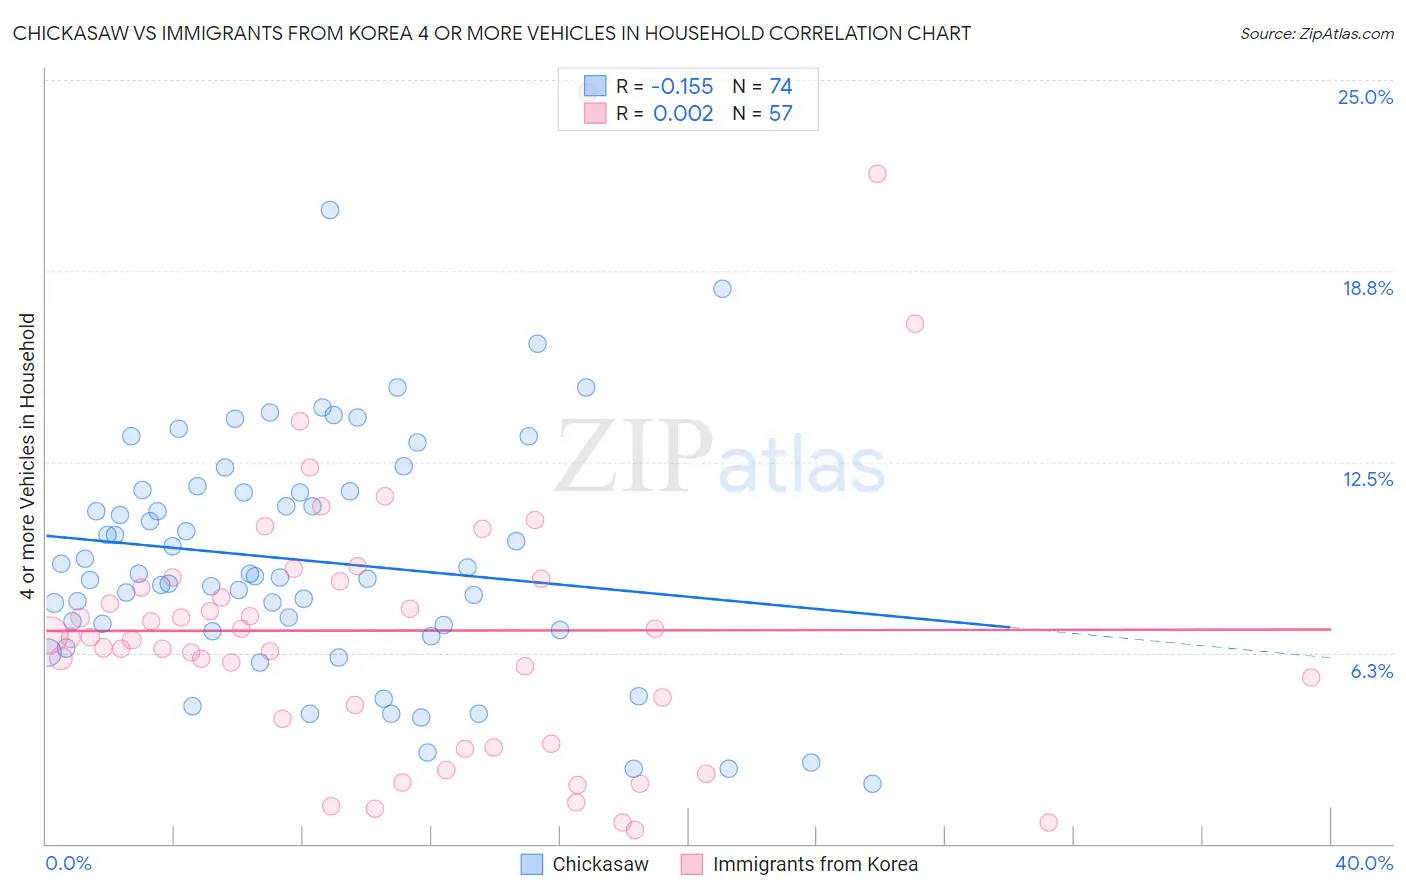
Chickasaw vs Immigrants from Korea 4 or more Vehicles in Household Correlation Chart
The statistical analysis conducted on geographies consisting of 147,524,339 people shows a poor negative correlation between the proportion of Chickasaw and percentage of households with 4 or more vehicles available in the United States with a correlation coefficient (R) of -0.155 and weighted average of 7.4%. Similarly, the statistical analysis conducted on geographies consisting of 414,077,591 people shows no correlation between the proportion of Immigrants from Korea and percentage of households with 4 or more vehicles available in the United States with a correlation coefficient (R) of 0.002 and weighted average of 6.8%, a difference of 10.0%.
4 or more Vehicles in Household Correlation Summary
| Measurement | Chickasaw | Immigrants from Korea |
| Minimum | 2.0% | 0.44% |
| Maximum | 20.8% | 24.6% |
| Range | 18.8% | 24.1% |
| Mean | 9.3% | 7.0% |
| Median | 8.8% | 6.7% |
| Interquartile 25% (IQ1) | 7.0% | 3.7% |
| Interquartile 75% (IQ3) | 11.5% | 8.6% |
| Interquartile Range (IQR) | 4.5% | 5.0% |
| Standard Deviation (Sample) | 3.8% | 4.7% |
| Standard Deviation (Population) | 3.8% | 4.6% |
Similar Demographics by 4 or more Vehicles in Household
Demographics Similar to Chickasaw by 4 or more Vehicles in Household
In terms of 4 or more vehicles in household, the demographic groups most similar to Chickasaw are Scottish (7.4%, a difference of 0.13%), German (7.5%, a difference of 0.20%), Scotch-Irish (7.4%, a difference of 0.30%), Portuguese (7.4%, a difference of 0.39%), and Icelander (7.4%, a difference of 0.69%).
| Demographics | Rating | Rank | 4 or more Vehicles in Household |
| Bangladeshis | 100.0 /100 | #64 | Exceptional 7.6% |
| Immigrants | Azores | 100.0 /100 | #65 | Exceptional 7.5% |
| Immigrants | Taiwan | 99.9 /100 | #66 | Exceptional 7.5% |
| Americans | 99.9 /100 | #67 | Exceptional 7.5% |
| Welsh | 99.9 /100 | #68 | Exceptional 7.5% |
| Germans | 99.9 /100 | #69 | Exceptional 7.5% |
| Scottish | 99.9 /100 | #70 | Exceptional 7.4% |
| Chickasaw | 99.9 /100 | #71 | Exceptional 7.4% |
| Scotch-Irish | 99.9 /100 | #72 | Exceptional 7.4% |
| Portuguese | 99.9 /100 | #73 | Exceptional 7.4% |
| Icelanders | 99.9 /100 | #74 | Exceptional 7.4% |
| Immigrants | Cambodia | 99.9 /100 | #75 | Exceptional 7.4% |
| Laotians | 99.9 /100 | #76 | Exceptional 7.4% |
| Apache | 99.9 /100 | #77 | Exceptional 7.4% |
| Whites/Caucasians | 99.8 /100 | #78 | Exceptional 7.4% |
Demographics Similar to Immigrants from Korea by 4 or more Vehicles in Household
In terms of 4 or more vehicles in household, the demographic groups most similar to Immigrants from Korea are Belgian (6.8%, a difference of 0.12%), Austrian (6.8%, a difference of 0.13%), Immigrants from Asia (6.8%, a difference of 0.23%), Immigrants (6.8%, a difference of 0.33%), and Immigrants from Germany (6.8%, a difference of 0.39%).
| Demographics | Rating | Rank | 4 or more Vehicles in Household |
| Comanche | 94.8 /100 | #120 | Exceptional 6.8% |
| Immigrants | Germany | 94.7 /100 | #121 | Exceptional 6.8% |
| Immigrants | Nicaragua | 94.7 /100 | #122 | Exceptional 6.8% |
| Immigrants | Immigrants | 94.6 /100 | #123 | Exceptional 6.8% |
| Immigrants | Asia | 94.4 /100 | #124 | Exceptional 6.8% |
| Austrians | 94.1 /100 | #125 | Exceptional 6.8% |
| Belgians | 94.1 /100 | #126 | Exceptional 6.8% |
| Immigrants | Korea | 93.8 /100 | #127 | Exceptional 6.8% |
| Immigrants | Bolivia | 92.5 /100 | #128 | Exceptional 6.7% |
| Immigrants | England | 92.0 /100 | #129 | Exceptional 6.7% |
| Immigrants | Scotland | 89.0 /100 | #130 | Excellent 6.7% |
| Maltese | 88.4 /100 | #131 | Excellent 6.7% |
| Immigrants | Netherlands | 87.8 /100 | #132 | Excellent 6.6% |
| Armenians | 86.9 /100 | #133 | Excellent 6.6% |
| Ottawa | 86.9 /100 | #134 | Excellent 6.6% |