French Canadian vs Immigrants from Korea Wage/Income Gap
COMPARE
French Canadian
Immigrants from Korea
Wage/Income Gap
Wage/Income Gap Comparison
French Canadians
Immigrants from Korea
28.1%
WAGE/INCOME GAP
0.4/ 100
METRIC RATING
283rd/ 347
METRIC RANK
27.8%
WAGE/INCOME GAP
0.8/ 100
METRIC RATING
272nd/ 347
METRIC RANK
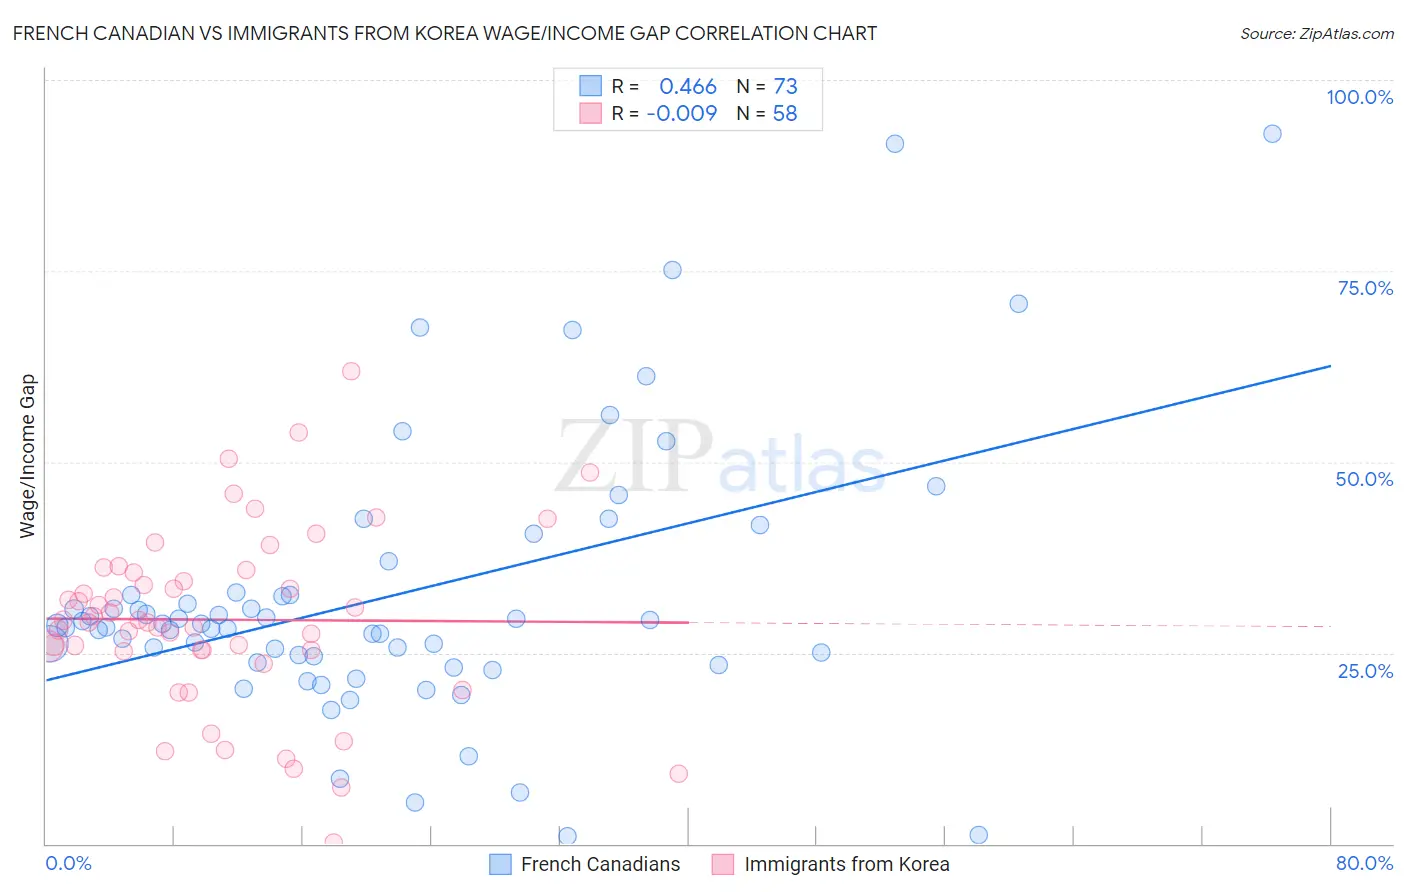
French Canadian vs Immigrants from Korea Wage/Income Gap Correlation Chart
The statistical analysis conducted on geographies consisting of 501,595,404 people shows a moderate positive correlation between the proportion of French Canadians and wage/income gap percentage in the United States with a correlation coefficient (R) of 0.466 and weighted average of 28.1%. Similarly, the statistical analysis conducted on geographies consisting of 416,007,882 people shows no correlation between the proportion of Immigrants from Korea and wage/income gap percentage in the United States with a correlation coefficient (R) of -0.009 and weighted average of 27.8%, a difference of 0.99%.
Wage/Income Gap Correlation Summary
| Measurement | French Canadian | Immigrants from Korea |
| Minimum | 0.99% | 0.13% |
| Maximum | 92.9% | 61.8% |
| Range | 91.9% | 61.7% |
| Mean | 32.4% | 29.3% |
| Median | 28.6% | 29.1% |
| Interquartile 25% (IQ1) | 24.1% | 25.3% |
| Interquartile 75% (IQ3) | 32.8% | 35.5% |
| Interquartile Range (IQR) | 8.6% | 10.2% |
| Standard Deviation (Sample) | 17.7% | 11.7% |
| Standard Deviation (Population) | 17.6% | 11.6% |
Demographics Similar to French Canadians and Immigrants from Korea by Wage/Income Gap
In terms of wage/income gap, the demographic groups most similar to French Canadians are Immigrants from Sweden (28.1%, a difference of 0.010%), Italian (28.1%, a difference of 0.14%), Immigrants from Austria (28.1%, a difference of 0.17%), South African (28.0%, a difference of 0.18%), and Okinawan (28.1%, a difference of 0.20%). Similarly, the demographic groups most similar to Immigrants from Korea are Ute (27.8%, a difference of 0.070%), Bulgarian (27.8%, a difference of 0.11%), Immigrants from Western Europe (27.8%, a difference of 0.15%), American (27.8%, a difference of 0.15%), and Immigrants from Japan (27.9%, a difference of 0.23%).
| Demographics | Rating | Rank | Wage/Income Gap |
| Turks | 1.0 /100 | #267 | Tragic 27.7% |
| New Zealanders | 1.0 /100 | #268 | Tragic 27.7% |
| Potawatomi | 0.9 /100 | #269 | Tragic 27.7% |
| Immigrants | Western Europe | 0.9 /100 | #270 | Tragic 27.8% |
| Ute | 0.8 /100 | #271 | Tragic 27.8% |
| Immigrants | Korea | 0.8 /100 | #272 | Tragic 27.8% |
| Bulgarians | 0.7 /100 | #273 | Tragic 27.8% |
| Americans | 0.7 /100 | #274 | Tragic 27.8% |
| Immigrants | Japan | 0.7 /100 | #275 | Tragic 27.9% |
| Lebanese | 0.7 /100 | #276 | Tragic 27.9% |
| Latvians | 0.7 /100 | #277 | Tragic 27.9% |
| Immigrants | England | 0.6 /100 | #278 | Tragic 27.9% |
| Romanians | 0.5 /100 | #279 | Tragic 28.0% |
| Russians | 0.5 /100 | #280 | Tragic 28.0% |
| Burmese | 0.5 /100 | #281 | Tragic 28.0% |
| South Africans | 0.5 /100 | #282 | Tragic 28.0% |
| French Canadians | 0.4 /100 | #283 | Tragic 28.1% |
| Immigrants | Sweden | 0.4 /100 | #284 | Tragic 28.1% |
| Italians | 0.4 /100 | #285 | Tragic 28.1% |
| Immigrants | Austria | 0.4 /100 | #286 | Tragic 28.1% |
| Okinawans | 0.4 /100 | #287 | Tragic 28.1% |