Chickasaw vs Immigrants from Central America Wage/Income Gap
COMPARE
Chickasaw
Immigrants from Central America
Wage/Income Gap
Wage/Income Gap Comparison
Chickasaw
Immigrants from Central America
27.2%
WAGE/INCOME GAP
3.5/ 100
METRIC RATING
244th/ 347
METRIC RANK
24.6%
WAGE/INCOME GAP
93.5/ 100
METRIC RATING
128th/ 347
METRIC RANK
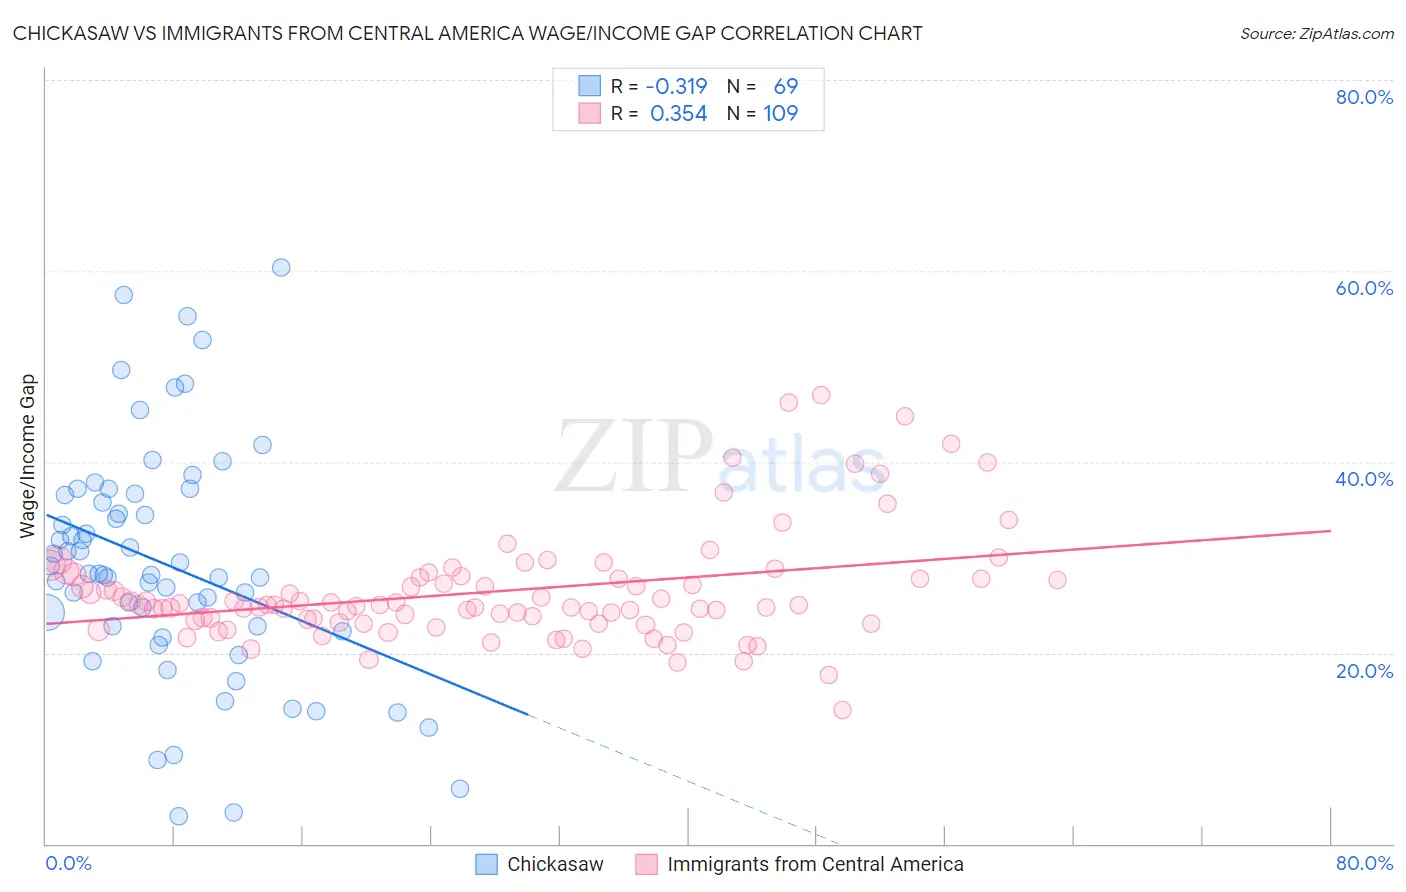
Chickasaw vs Immigrants from Central America Wage/Income Gap Correlation Chart
The statistical analysis conducted on geographies consisting of 147,661,645 people shows a mild negative correlation between the proportion of Chickasaw and wage/income gap percentage in the United States with a correlation coefficient (R) of -0.319 and weighted average of 27.2%. Similarly, the statistical analysis conducted on geographies consisting of 534,855,009 people shows a mild positive correlation between the proportion of Immigrants from Central America and wage/income gap percentage in the United States with a correlation coefficient (R) of 0.354 and weighted average of 24.6%, a difference of 10.2%.
Wage/Income Gap Correlation Summary
| Measurement | Chickasaw | Immigrants from Central America |
| Minimum | 2.8% | 13.9% |
| Maximum | 60.4% | 47.0% |
| Range | 57.6% | 33.1% |
| Mean | 29.3% | 26.4% |
| Median | 28.3% | 25.0% |
| Interquartile 25% (IQ1) | 22.5% | 23.3% |
| Interquartile 75% (IQ3) | 36.6% | 27.9% |
| Interquartile Range (IQR) | 14.2% | 4.6% |
| Standard Deviation (Sample) | 12.2% | 5.7% |
| Standard Deviation (Population) | 12.2% | 5.7% |
Similar Demographics by Wage/Income Gap
Demographics Similar to Chickasaw by Wage/Income Gap
In terms of wage/income gap, the demographic groups most similar to Chickasaw are Immigrants from the Azores (27.2%, a difference of 0.020%), Spanish (27.1%, a difference of 0.070%), Immigrants from Sri Lanka (27.1%, a difference of 0.080%), Nonimmigrants (27.2%, a difference of 0.090%), and Creek (27.1%, a difference of 0.13%).
| Demographics | Rating | Rank | Wage/Income Gap |
| Immigrants | Eastern Asia | 4.4 /100 | #237 | Tragic 27.1% |
| Osage | 4.4 /100 | #238 | Tragic 27.1% |
| Estonians | 4.3 /100 | #239 | Tragic 27.1% |
| Immigrants | Europe | 3.8 /100 | #240 | Tragic 27.1% |
| Creek | 3.8 /100 | #241 | Tragic 27.1% |
| Immigrants | Sri Lanka | 3.7 /100 | #242 | Tragic 27.1% |
| Spanish | 3.6 /100 | #243 | Tragic 27.1% |
| Chickasaw | 3.5 /100 | #244 | Tragic 27.2% |
| Immigrants | Azores | 3.5 /100 | #245 | Tragic 27.2% |
| Immigrants | Nonimmigrants | 3.3 /100 | #246 | Tragic 27.2% |
| Celtics | 2.8 /100 | #247 | Tragic 27.3% |
| Cypriots | 2.8 /100 | #248 | Tragic 27.3% |
| Carpatho Rusyns | 2.7 /100 | #249 | Tragic 27.3% |
| Immigrants | Czechoslovakia | 2.7 /100 | #250 | Tragic 27.3% |
| Immigrants | Norway | 2.5 /100 | #251 | Tragic 27.3% |
Demographics Similar to Immigrants from Central America by Wage/Income Gap
In terms of wage/income gap, the demographic groups most similar to Immigrants from Central America are Yup'ik (24.7%, a difference of 0.050%), Immigrants from Uruguay (24.6%, a difference of 0.070%), German Russian (24.6%, a difference of 0.070%), Alsatian (24.7%, a difference of 0.080%), and Spanish American (24.6%, a difference of 0.090%).
| Demographics | Rating | Rank | Wage/Income Gap |
| Immigrants | Thailand | 94.9 /100 | #121 | Exceptional 24.5% |
| Apache | 94.8 /100 | #122 | Exceptional 24.5% |
| Natives/Alaskans | 94.6 /100 | #123 | Exceptional 24.6% |
| Immigrants | South America | 93.9 /100 | #124 | Exceptional 24.6% |
| Spanish Americans | 93.8 /100 | #125 | Exceptional 24.6% |
| Immigrants | Uruguay | 93.8 /100 | #126 | Exceptional 24.6% |
| German Russians | 93.7 /100 | #127 | Exceptional 24.6% |
| Immigrants | Central America | 93.5 /100 | #128 | Exceptional 24.6% |
| Yup'ik | 93.3 /100 | #129 | Exceptional 24.7% |
| Alsatians | 93.2 /100 | #130 | Exceptional 24.7% |
| Immigrants | Philippines | 93.0 /100 | #131 | Exceptional 24.7% |
| Immigrants | Costa Rica | 92.4 /100 | #132 | Exceptional 24.7% |
| Colombians | 92.4 /100 | #133 | Exceptional 24.7% |
| Mexican American Indians | 92.2 /100 | #134 | Exceptional 24.7% |
| South American Indians | 92.0 /100 | #135 | Exceptional 24.7% |