Venezuelan vs Immigrants from Korea Wage/Income Gap
COMPARE
Venezuelan
Immigrants from Korea
Wage/Income Gap
Wage/Income Gap Comparison
Venezuelans
Immigrants from Korea
26.3%
WAGE/INCOME GAP
21.5/ 100
METRIC RATING
198th/ 347
METRIC RANK
27.8%
WAGE/INCOME GAP
0.8/ 100
METRIC RATING
272nd/ 347
METRIC RANK
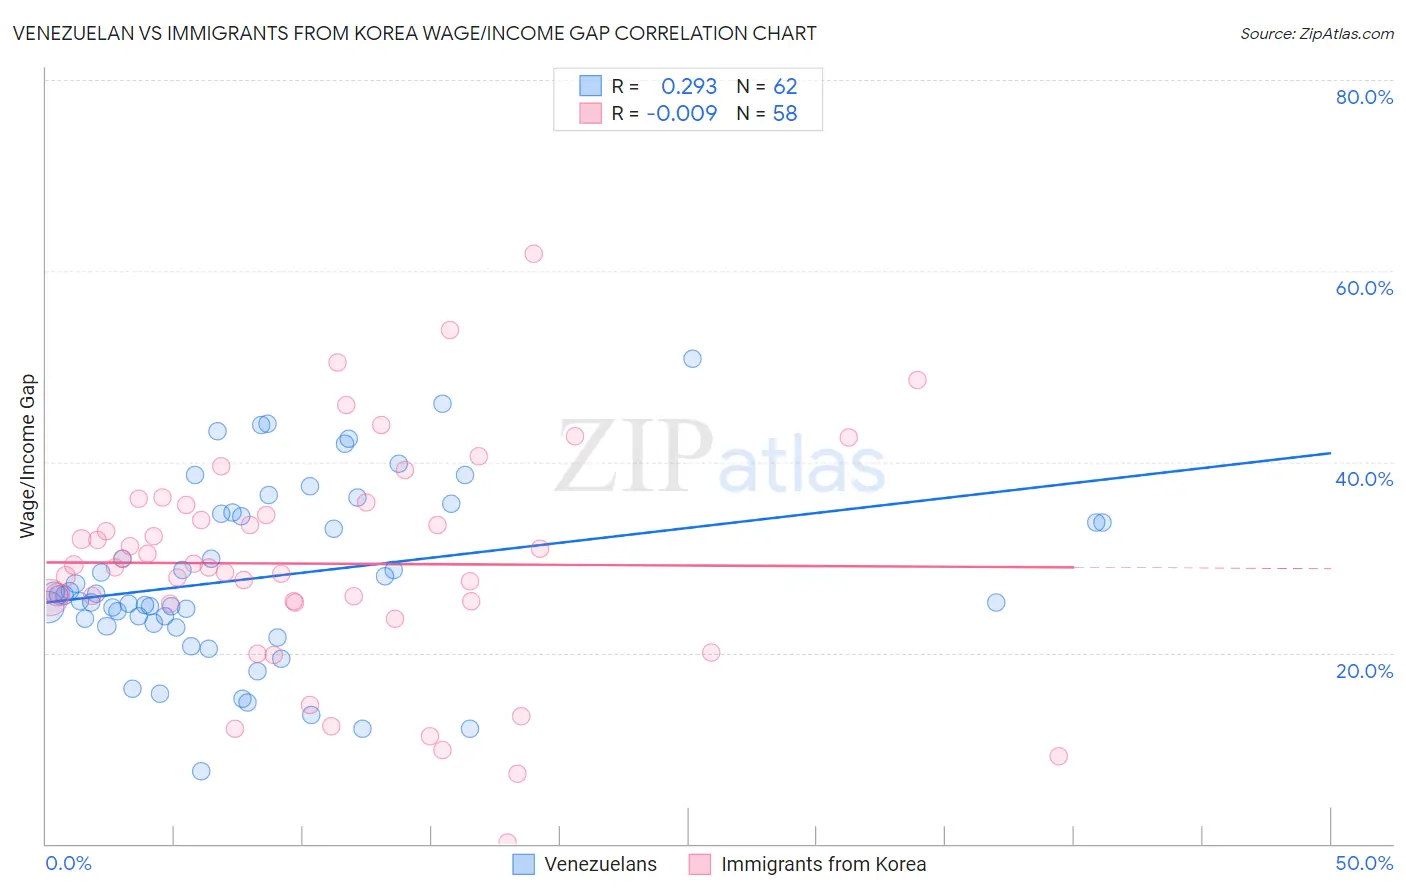
Venezuelan vs Immigrants from Korea Wage/Income Gap Correlation Chart
The statistical analysis conducted on geographies consisting of 306,223,372 people shows a weak positive correlation between the proportion of Venezuelans and wage/income gap percentage in the United States with a correlation coefficient (R) of 0.293 and weighted average of 26.3%. Similarly, the statistical analysis conducted on geographies consisting of 416,007,882 people shows no correlation between the proportion of Immigrants from Korea and wage/income gap percentage in the United States with a correlation coefficient (R) of -0.009 and weighted average of 27.8%, a difference of 5.6%.
Wage/Income Gap Correlation Summary
| Measurement | Venezuelan | Immigrants from Korea |
| Minimum | 7.6% | 0.13% |
| Maximum | 50.8% | 61.8% |
| Range | 43.2% | 61.7% |
| Mean | 27.9% | 29.3% |
| Median | 26.1% | 29.1% |
| Interquartile 25% (IQ1) | 23.1% | 25.3% |
| Interquartile 75% (IQ3) | 34.6% | 35.5% |
| Interquartile Range (IQR) | 11.4% | 10.2% |
| Standard Deviation (Sample) | 9.2% | 11.7% |
| Standard Deviation (Population) | 9.2% | 11.6% |
Similar Demographics by Wage/Income Gap
Demographics Similar to Venezuelans by Wage/Income Gap
In terms of wage/income gap, the demographic groups most similar to Venezuelans are Zimbabwean (26.3%, a difference of 0.010%), Immigrants from Western Asia (26.3%, a difference of 0.020%), Dutch West Indian (26.3%, a difference of 0.050%), Delaware (26.3%, a difference of 0.050%), and Immigrants from Malaysia (26.3%, a difference of 0.070%).
| Demographics | Rating | Rank | Wage/Income Gap |
| Immigrants | Venezuela | 24.7 /100 | #191 | Fair 26.2% |
| Immigrants | Bulgaria | 22.5 /100 | #192 | Fair 26.3% |
| Immigrants | Jordan | 22.4 /100 | #193 | Fair 26.3% |
| Chileans | 22.3 /100 | #194 | Fair 26.3% |
| Immigrants | Malaysia | 22.2 /100 | #195 | Fair 26.3% |
| Immigrants | Western Asia | 21.7 /100 | #196 | Fair 26.3% |
| Zimbabweans | 21.6 /100 | #197 | Fair 26.3% |
| Venezuelans | 21.5 /100 | #198 | Fair 26.3% |
| Dutch West Indians | 21.0 /100 | #199 | Fair 26.3% |
| Delaware | 20.9 /100 | #200 | Fair 26.3% |
| Immigrants | Syria | 19.3 /100 | #201 | Poor 26.4% |
| Laotians | 19.2 /100 | #202 | Poor 26.4% |
| Immigrants | Eastern Europe | 19.2 /100 | #203 | Poor 26.4% |
| Immigrants | Russia | 19.0 /100 | #204 | Poor 26.4% |
| Immigrants | Southern Europe | 17.3 /100 | #205 | Poor 26.4% |
Demographics Similar to Immigrants from Korea by Wage/Income Gap
In terms of wage/income gap, the demographic groups most similar to Immigrants from Korea are Ute (27.8%, a difference of 0.070%), Bulgarian (27.8%, a difference of 0.11%), Immigrants from Western Europe (27.8%, a difference of 0.15%), American (27.8%, a difference of 0.15%), and Immigrants from Japan (27.9%, a difference of 0.23%).
| Demographics | Rating | Rank | Wage/Income Gap |
| Serbians | 1.0 /100 | #265 | Tragic 27.7% |
| Hmong | 1.0 /100 | #266 | Tragic 27.7% |
| Turks | 1.0 /100 | #267 | Tragic 27.7% |
| New Zealanders | 1.0 /100 | #268 | Tragic 27.7% |
| Potawatomi | 0.9 /100 | #269 | Tragic 27.7% |
| Immigrants | Western Europe | 0.9 /100 | #270 | Tragic 27.8% |
| Ute | 0.8 /100 | #271 | Tragic 27.8% |
| Immigrants | Korea | 0.8 /100 | #272 | Tragic 27.8% |
| Bulgarians | 0.7 /100 | #273 | Tragic 27.8% |
| Americans | 0.7 /100 | #274 | Tragic 27.8% |
| Immigrants | Japan | 0.7 /100 | #275 | Tragic 27.9% |
| Lebanese | 0.7 /100 | #276 | Tragic 27.9% |
| Latvians | 0.7 /100 | #277 | Tragic 27.9% |
| Immigrants | England | 0.6 /100 | #278 | Tragic 27.9% |
| Romanians | 0.5 /100 | #279 | Tragic 28.0% |