Cheyenne vs Puerto Rican Median Female Earnings
COMPARE
Cheyenne
Puerto Rican
Median Female Earnings
Median Female Earnings Comparison
Cheyenne
Puerto Ricans
$35,673
MEDIAN FEMALE EARNINGS
0.0/ 100
METRIC RATING
294th/ 347
METRIC RANK
$31,560
MEDIAN FEMALE EARNINGS
0.0/ 100
METRIC RATING
345th/ 347
METRIC RANK
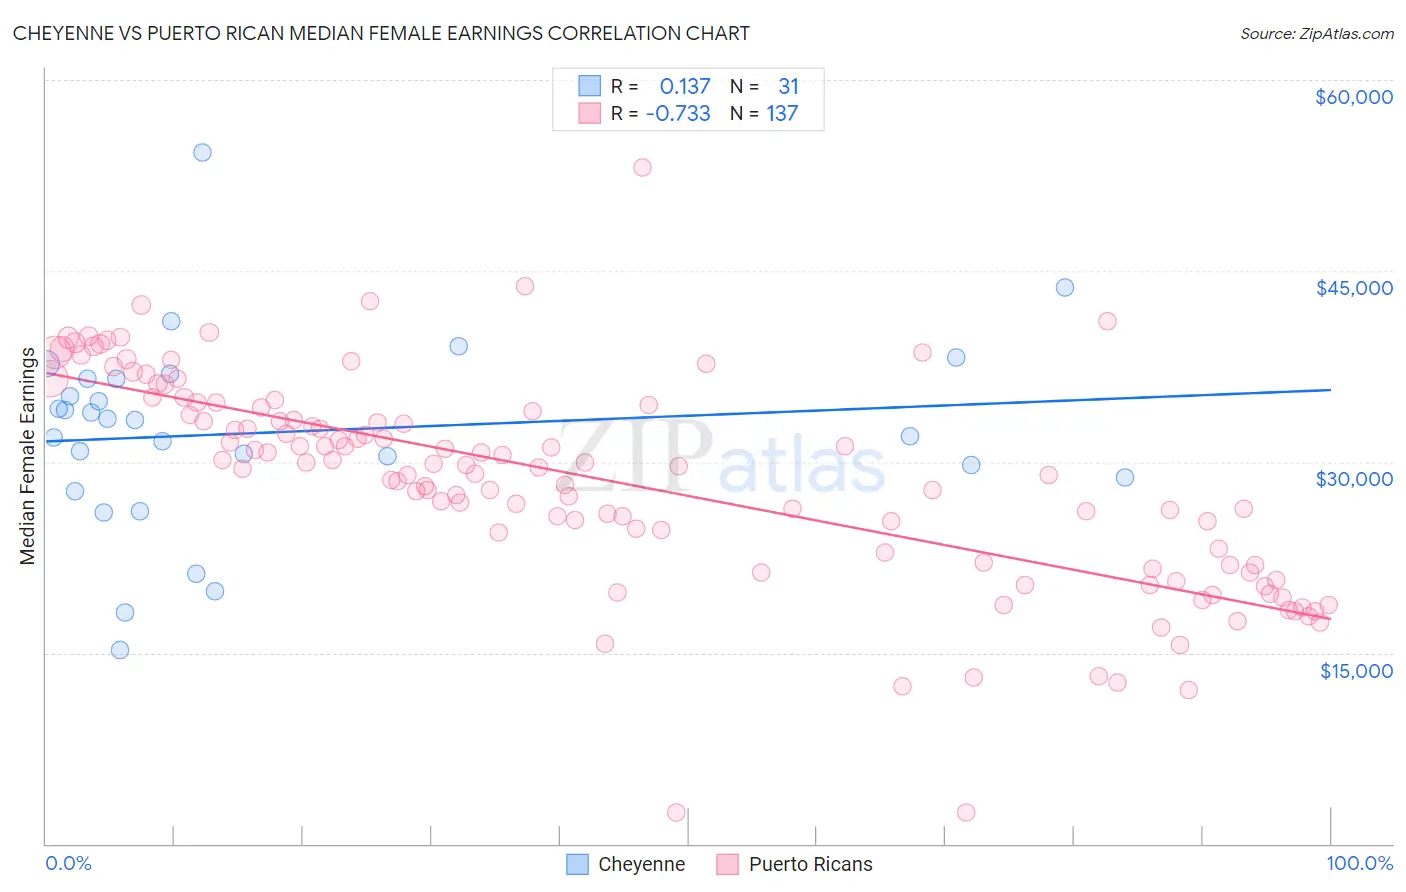
Cheyenne vs Puerto Rican Median Female Earnings Correlation Chart
The statistical analysis conducted on geographies consisting of 80,682,287 people shows a poor positive correlation between the proportion of Cheyenne and median female earnings in the United States with a correlation coefficient (R) of 0.137 and weighted average of $35,673. Similarly, the statistical analysis conducted on geographies consisting of 527,573,367 people shows a strong negative correlation between the proportion of Puerto Ricans and median female earnings in the United States with a correlation coefficient (R) of -0.733 and weighted average of $31,560, a difference of 13.0%.
Median Female Earnings Correlation Summary
| Measurement | Cheyenne | Puerto Rican |
| Minimum | $15,218 | $2,499 |
| Maximum | $54,333 | $53,092 |
| Range | $39,115 | $50,593 |
| Mean | $32,359 | $28,571 |
| Median | $33,313 | $29,640 |
| Interquartile 25% (IQ1) | $28,775 | $21,994 |
| Interquartile 75% (IQ3) | $36,563 | $34,369 |
| Interquartile Range (IQR) | $7,788 | $12,375 |
| Standard Deviation (Sample) | $7,704 | $8,353 |
| Standard Deviation (Population) | $7,579 | $8,323 |
Similar Demographics by Median Female Earnings
Demographics Similar to Cheyenne by Median Female Earnings
In terms of median female earnings, the demographic groups most similar to Cheyenne are Comanche ($35,661, a difference of 0.030%), Guatemalan ($35,695, a difference of 0.060%), Mexican American Indian ($35,629, a difference of 0.12%), American ($35,777, a difference of 0.29%), and Hmong ($35,498, a difference of 0.49%).
| Demographics | Rating | Rank | Median Female Earnings |
| Immigrants | Nicaragua | 0.0 /100 | #287 | Tragic $36,023 |
| Immigrants | Zaire | 0.0 /100 | #288 | Tragic $36,017 |
| Bangladeshis | 0.0 /100 | #289 | Tragic $35,960 |
| Central American Indians | 0.0 /100 | #290 | Tragic $35,930 |
| Blackfeet | 0.0 /100 | #291 | Tragic $35,864 |
| Americans | 0.0 /100 | #292 | Tragic $35,777 |
| Guatemalans | 0.0 /100 | #293 | Tragic $35,695 |
| Cheyenne | 0.0 /100 | #294 | Tragic $35,673 |
| Comanche | 0.0 /100 | #295 | Tragic $35,661 |
| Mexican American Indians | 0.0 /100 | #296 | Tragic $35,629 |
| Hmong | 0.0 /100 | #297 | Tragic $35,498 |
| Immigrants | Micronesia | 0.0 /100 | #298 | Tragic $35,477 |
| Immigrants | Guatemala | 0.0 /100 | #299 | Tragic $35,444 |
| Yuman | 0.0 /100 | #300 | Tragic $35,377 |
| Pima | 0.0 /100 | #301 | Tragic $35,326 |
Demographics Similar to Puerto Ricans by Median Female Earnings
In terms of median female earnings, the demographic groups most similar to Puerto Ricans are Arapaho ($31,489, a difference of 0.23%), Lumbee ($32,500, a difference of 3.0%), Pueblo ($32,564, a difference of 3.2%), Yup'ik ($32,730, a difference of 3.7%), and Houma ($30,343, a difference of 4.0%).
| Demographics | Rating | Rank | Median Female Earnings |
| Mexicans | 0.0 /100 | #333 | Tragic $33,664 |
| Spanish American Indians | 0.0 /100 | #334 | Tragic $33,625 |
| Creek | 0.0 /100 | #335 | Tragic $33,437 |
| Ottawa | 0.0 /100 | #336 | Tragic $33,378 |
| Yakama | 0.0 /100 | #337 | Tragic $33,354 |
| Immigrants | Cuba | 0.0 /100 | #338 | Tragic $33,291 |
| Immigrants | Mexico | 0.0 /100 | #339 | Tragic $33,236 |
| Tohono O'odham | 0.0 /100 | #340 | Tragic $33,205 |
| Navajo | 0.0 /100 | #341 | Tragic $33,046 |
| Yup'ik | 0.0 /100 | #342 | Tragic $32,730 |
| Pueblo | 0.0 /100 | #343 | Tragic $32,564 |
| Lumbee | 0.0 /100 | #344 | Tragic $32,500 |
| Puerto Ricans | 0.0 /100 | #345 | Tragic $31,560 |
| Arapaho | 0.0 /100 | #346 | Tragic $31,489 |
| Houma | 0.0 /100 | #347 | Tragic $30,343 |