Central American vs Immigrants from Somalia Median Male Earnings
COMPARE
Central American
Immigrants from Somalia
Median Male Earnings
Median Male Earnings Comparison
Central Americans
Immigrants from Somalia
$48,093
MEDIAN MALE EARNINGS
0.2/ 100
METRIC RATING
282nd/ 347
METRIC RANK
$48,439
MEDIAN MALE EARNINGS
0.3/ 100
METRIC RATING
275th/ 347
METRIC RANK
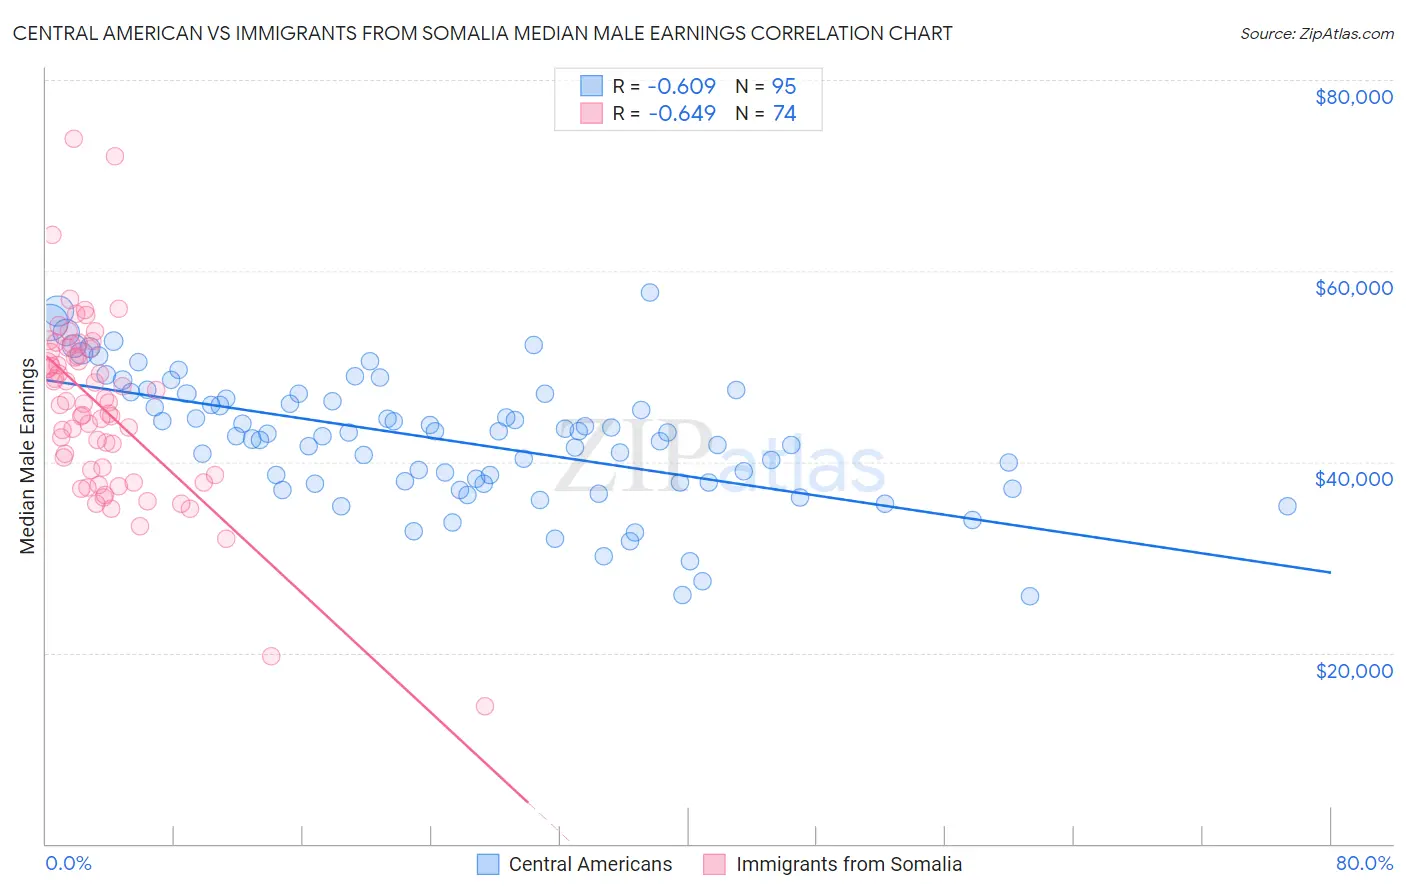
Central American vs Immigrants from Somalia Median Male Earnings Correlation Chart
The statistical analysis conducted on geographies consisting of 504,312,553 people shows a significant negative correlation between the proportion of Central Americans and median male earnings in the United States with a correlation coefficient (R) of -0.609 and weighted average of $48,093. Similarly, the statistical analysis conducted on geographies consisting of 92,109,982 people shows a significant negative correlation between the proportion of Immigrants from Somalia and median male earnings in the United States with a correlation coefficient (R) of -0.649 and weighted average of $48,439, a difference of 0.72%.
Median Male Earnings Correlation Summary
| Measurement | Central American | Immigrants from Somalia |
| Minimum | $25,893 | $14,382 |
| Maximum | $57,715 | $73,796 |
| Range | $31,822 | $59,414 |
| Mean | $42,312 | $45,683 |
| Median | $42,955 | $46,151 |
| Interquartile 25% (IQ1) | $37,781 | $39,154 |
| Interquartile 75% (IQ3) | $47,084 | $51,463 |
| Interquartile Range (IQR) | $9,303 | $12,309 |
| Standard Deviation (Sample) | $6,615 | $9,409 |
| Standard Deviation (Population) | $6,580 | $9,346 |
Demographics Similar to Central Americans and Immigrants from Somalia by Median Male Earnings
In terms of median male earnings, the demographic groups most similar to Central Americans are Marshallese ($48,137, a difference of 0.090%), Immigrants from Jamaica ($48,040, a difference of 0.11%), African ($47,994, a difference of 0.21%), Paiute ($47,991, a difference of 0.21%), and Mexican American Indian ($47,990, a difference of 0.22%). Similarly, the demographic groups most similar to Immigrants from Somalia are Blackfeet ($48,402, a difference of 0.080%), Colville ($48,516, a difference of 0.16%), Belizean ($48,358, a difference of 0.17%), Immigrants from Liberia ($48,317, a difference of 0.25%), and Hmong ($48,254, a difference of 0.38%).
| Demographics | Rating | Rank | Median Male Earnings |
| Ute | 0.4 /100 | #268 | Tragic $48,899 |
| Tsimshian | 0.4 /100 | #269 | Tragic $48,836 |
| Potawatomi | 0.4 /100 | #270 | Tragic $48,768 |
| Cherokee | 0.3 /100 | #271 | Tragic $48,669 |
| Salvadorans | 0.3 /100 | #272 | Tragic $48,646 |
| Jamaicans | 0.3 /100 | #273 | Tragic $48,632 |
| Colville | 0.3 /100 | #274 | Tragic $48,516 |
| Immigrants | Somalia | 0.3 /100 | #275 | Tragic $48,439 |
| Blackfeet | 0.3 /100 | #276 | Tragic $48,402 |
| Belizeans | 0.2 /100 | #277 | Tragic $48,358 |
| Immigrants | Liberia | 0.2 /100 | #278 | Tragic $48,317 |
| Hmong | 0.2 /100 | #279 | Tragic $48,254 |
| Comanche | 0.2 /100 | #280 | Tragic $48,202 |
| Marshallese | 0.2 /100 | #281 | Tragic $48,137 |
| Central Americans | 0.2 /100 | #282 | Tragic $48,093 |
| Immigrants | Jamaica | 0.2 /100 | #283 | Tragic $48,040 |
| Africans | 0.2 /100 | #284 | Tragic $47,994 |
| Paiute | 0.2 /100 | #285 | Tragic $47,991 |
| Mexican American Indians | 0.2 /100 | #286 | Tragic $47,990 |
| Immigrants | El Salvador | 0.2 /100 | #287 | Tragic $47,973 |
| Shoshone | 0.2 /100 | #288 | Tragic $47,930 |