Celtic vs Czechoslovakian Median Earnings
COMPARE
Celtic
Czechoslovakian
Median Earnings
Median Earnings Comparison
Celtics
Czechoslovakians
$45,732
MEDIAN EARNINGS
27.2/ 100
METRIC RATING
201st/ 347
METRIC RANK
$46,658
MEDIAN EARNINGS
57.8/ 100
METRIC RATING
166th/ 347
METRIC RANK
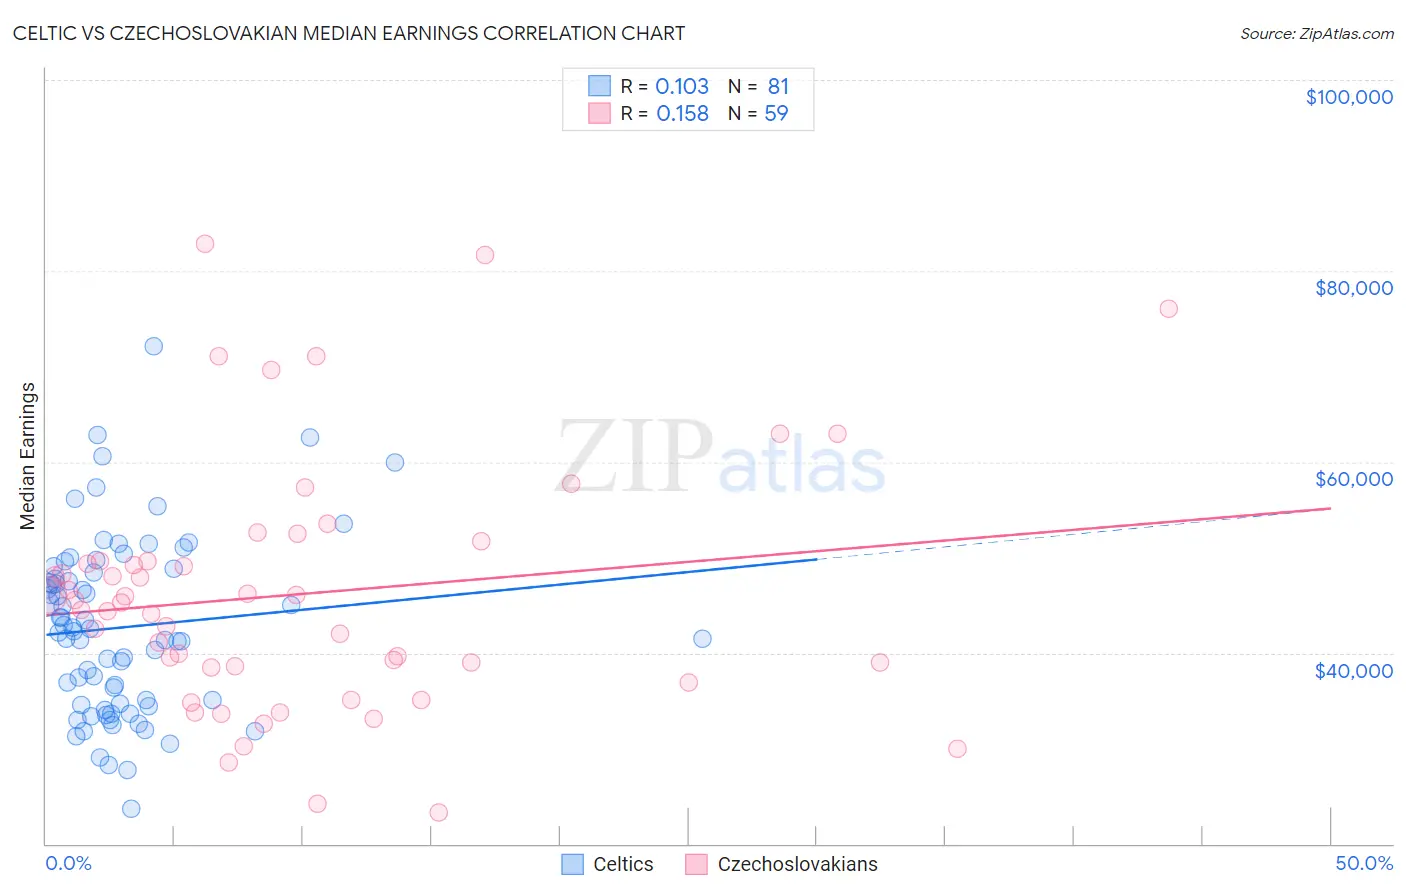
Celtic vs Czechoslovakian Median Earnings Correlation Chart
The statistical analysis conducted on geographies consisting of 168,867,558 people shows a poor positive correlation between the proportion of Celtics and median earnings in the United States with a correlation coefficient (R) of 0.103 and weighted average of $45,732. Similarly, the statistical analysis conducted on geographies consisting of 368,633,648 people shows a poor positive correlation between the proportion of Czechoslovakians and median earnings in the United States with a correlation coefficient (R) of 0.158 and weighted average of $46,658, a difference of 2.0%.
Median Earnings Correlation Summary
| Measurement | Celtic | Czechoslovakian |
| Minimum | $23,710 | $23,333 |
| Maximum | $72,162 | $82,793 |
| Range | $48,452 | $59,460 |
| Mean | $42,685 | $46,151 |
| Median | $42,318 | $45,298 |
| Interquartile 25% (IQ1) | $34,608 | $38,524 |
| Interquartile 75% (IQ3) | $48,561 | $49,625 |
| Interquartile Range (IQR) | $13,953 | $11,101 |
| Standard Deviation (Sample) | $9,238 | $13,082 |
| Standard Deviation (Population) | $9,181 | $12,971 |
Similar Demographics by Median Earnings
Demographics Similar to Celtics by Median Earnings
In terms of median earnings, the demographic groups most similar to Celtics are Immigrants from Trinidad and Tobago ($45,729, a difference of 0.010%), Welsh ($45,710, a difference of 0.050%), Immigrants from Uruguay ($45,682, a difference of 0.11%), Tongan ($45,665, a difference of 0.15%), and Immigrants from Barbados ($45,816, a difference of 0.18%).
| Demographics | Rating | Rank | Median Earnings |
| Immigrants | Costa Rica | 33.0 /100 | #194 | Fair $45,928 |
| Immigrants | St. Vincent and the Grenadines | 32.4 /100 | #195 | Fair $45,908 |
| Yugoslavians | 30.5 /100 | #196 | Fair $45,846 |
| Barbadians | 30.5 /100 | #197 | Fair $45,846 |
| Trinidadians and Tobagonians | 29.7 /100 | #198 | Fair $45,820 |
| Immigrants | Barbados | 29.6 /100 | #199 | Fair $45,816 |
| Immigrants | Azores | 29.5 /100 | #200 | Fair $45,812 |
| Celtics | 27.2 /100 | #201 | Fair $45,732 |
| Immigrants | Trinidad and Tobago | 27.1 /100 | #202 | Fair $45,729 |
| Welsh | 26.6 /100 | #203 | Fair $45,710 |
| Immigrants | Uruguay | 25.9 /100 | #204 | Fair $45,682 |
| Tongans | 25.4 /100 | #205 | Fair $45,665 |
| Immigrants | Ghana | 24.8 /100 | #206 | Fair $45,641 |
| Immigrants | Senegal | 24.0 /100 | #207 | Fair $45,611 |
| Immigrants | Bosnia and Herzegovina | 23.7 /100 | #208 | Fair $45,600 |
Demographics Similar to Czechoslovakians by Median Earnings
In terms of median earnings, the demographic groups most similar to Czechoslovakians are Costa Rican ($46,645, a difference of 0.030%), Immigrants from Africa ($46,564, a difference of 0.20%), Immigrants from South America ($46,548, a difference of 0.24%), South American ($46,804, a difference of 0.31%), and Immigrants ($46,478, a difference of 0.39%).
| Demographics | Rating | Rank | Median Earnings |
| Immigrants | Peru | 69.6 /100 | #159 | Good $47,025 |
| Alsatians | 69.6 /100 | #160 | Good $47,023 |
| Immigrants | Eastern Africa | 68.0 /100 | #161 | Good $46,969 |
| South American Indians | 67.4 /100 | #162 | Good $46,952 |
| Icelanders | 66.3 /100 | #163 | Good $46,916 |
| Norwegians | 64.7 /100 | #164 | Good $46,865 |
| South Americans | 62.7 /100 | #165 | Good $46,804 |
| Czechoslovakians | 57.8 /100 | #166 | Average $46,658 |
| Costa Ricans | 57.4 /100 | #167 | Average $46,645 |
| Immigrants | Africa | 54.6 /100 | #168 | Average $46,564 |
| Immigrants | South America | 54.0 /100 | #169 | Average $46,548 |
| Immigrants | Immigrants | 51.6 /100 | #170 | Average $46,478 |
| Scottish | 51.1 /100 | #171 | Average $46,463 |
| Kenyans | 51.0 /100 | #172 | Average $46,462 |
| Ghanaians | 50.3 /100 | #173 | Average $46,440 |