Celtic vs Nonimmigrants Median Earnings
COMPARE
Celtic
Nonimmigrants
Median Earnings
Median Earnings Comparison
Celtics
Nonimmigrants
$45,732
MEDIAN EARNINGS
27.2/ 100
METRIC RATING
201st/ 347
METRIC RANK
$44,117
MEDIAN EARNINGS
3.7/ 100
METRIC RATING
244th/ 347
METRIC RANK
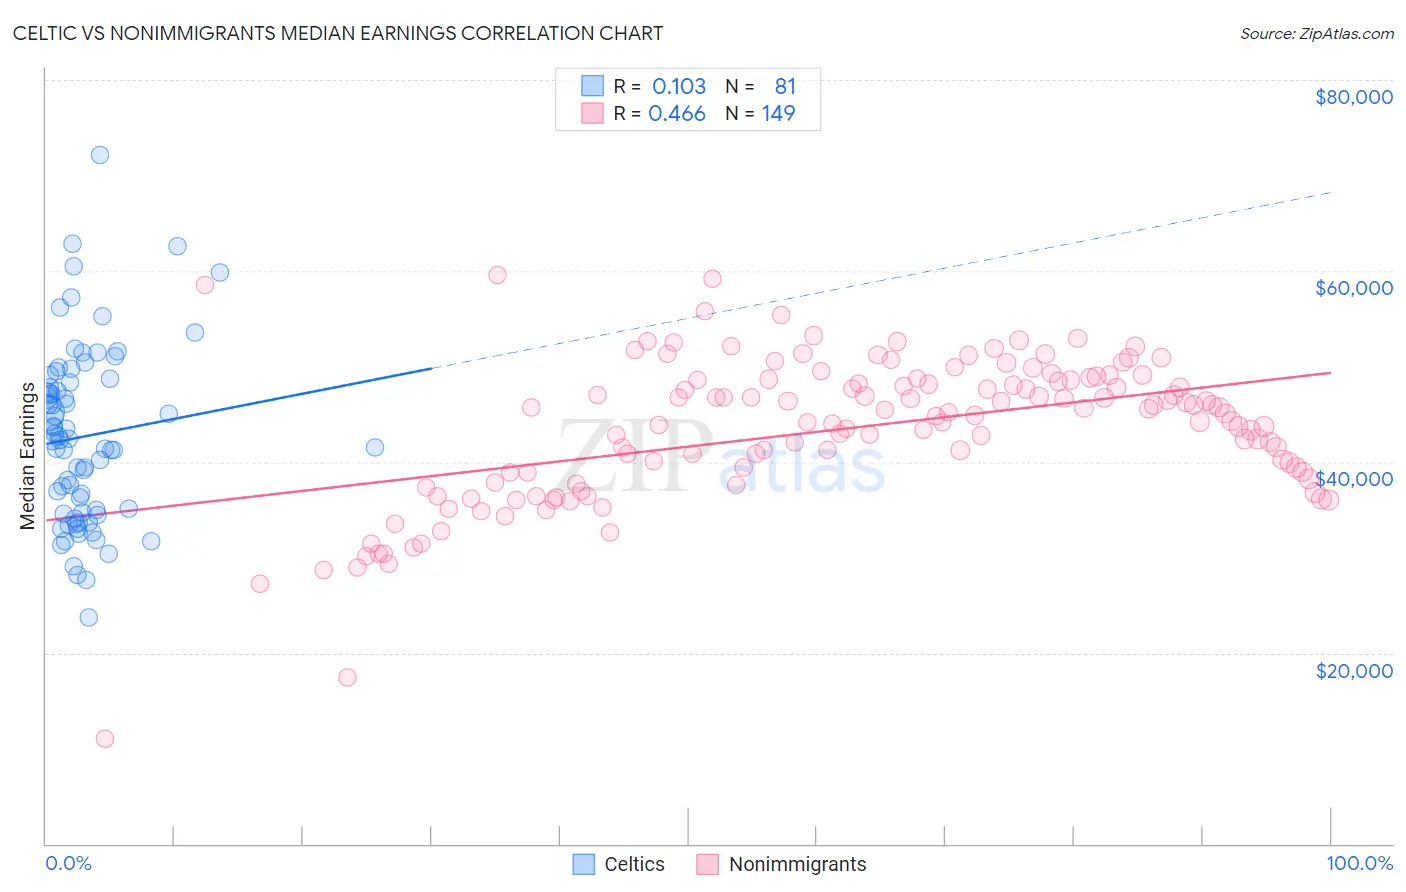
Celtic vs Nonimmigrants Median Earnings Correlation Chart
The statistical analysis conducted on geographies consisting of 168,867,558 people shows a poor positive correlation between the proportion of Celtics and median earnings in the United States with a correlation coefficient (R) of 0.103 and weighted average of $45,732. Similarly, the statistical analysis conducted on geographies consisting of 583,813,496 people shows a moderate positive correlation between the proportion of Nonimmigrants and median earnings in the United States with a correlation coefficient (R) of 0.466 and weighted average of $44,117, a difference of 3.7%.
Median Earnings Correlation Summary
| Measurement | Celtic | Nonimmigrants |
| Minimum | $23,710 | $10,941 |
| Maximum | $72,162 | $59,517 |
| Range | $48,452 | $48,576 |
| Mean | $42,685 | $43,445 |
| Median | $42,318 | $45,090 |
| Interquartile 25% (IQ1) | $34,608 | $38,540 |
| Interquartile 75% (IQ3) | $48,561 | $48,620 |
| Interquartile Range (IQR) | $13,953 | $10,080 |
| Standard Deviation (Sample) | $9,238 | $7,587 |
| Standard Deviation (Population) | $9,181 | $7,562 |
Similar Demographics by Median Earnings
Demographics Similar to Celtics by Median Earnings
In terms of median earnings, the demographic groups most similar to Celtics are Immigrants from Trinidad and Tobago ($45,729, a difference of 0.010%), Welsh ($45,710, a difference of 0.050%), Immigrants from Uruguay ($45,682, a difference of 0.11%), Tongan ($45,665, a difference of 0.15%), and Immigrants from Barbados ($45,816, a difference of 0.18%).
| Demographics | Rating | Rank | Median Earnings |
| Immigrants | Costa Rica | 33.0 /100 | #194 | Fair $45,928 |
| Immigrants | St. Vincent and the Grenadines | 32.4 /100 | #195 | Fair $45,908 |
| Yugoslavians | 30.5 /100 | #196 | Fair $45,846 |
| Barbadians | 30.5 /100 | #197 | Fair $45,846 |
| Trinidadians and Tobagonians | 29.7 /100 | #198 | Fair $45,820 |
| Immigrants | Barbados | 29.6 /100 | #199 | Fair $45,816 |
| Immigrants | Azores | 29.5 /100 | #200 | Fair $45,812 |
| Celtics | 27.2 /100 | #201 | Fair $45,732 |
| Immigrants | Trinidad and Tobago | 27.1 /100 | #202 | Fair $45,729 |
| Welsh | 26.6 /100 | #203 | Fair $45,710 |
| Immigrants | Uruguay | 25.9 /100 | #204 | Fair $45,682 |
| Tongans | 25.4 /100 | #205 | Fair $45,665 |
| Immigrants | Ghana | 24.8 /100 | #206 | Fair $45,641 |
| Immigrants | Senegal | 24.0 /100 | #207 | Fair $45,611 |
| Immigrants | Bosnia and Herzegovina | 23.7 /100 | #208 | Fair $45,600 |
Demographics Similar to Nonimmigrants by Median Earnings
In terms of median earnings, the demographic groups most similar to Nonimmigrants are Subsaharan African ($44,118, a difference of 0.0%), Immigrants from Venezuela ($44,163, a difference of 0.10%), Samoan ($44,206, a difference of 0.20%), Immigrants from Burma/Myanmar ($43,998, a difference of 0.27%), and Aleut ($44,241, a difference of 0.28%).
| Demographics | Rating | Rank | Median Earnings |
| Immigrants | Ecuador | 5.9 /100 | #237 | Tragic $44,462 |
| Sudanese | 5.6 /100 | #238 | Tragic $44,419 |
| Senegalese | 5.3 /100 | #239 | Tragic $44,373 |
| Aleuts | 4.4 /100 | #240 | Tragic $44,241 |
| Samoans | 4.2 /100 | #241 | Tragic $44,206 |
| Immigrants | Venezuela | 4.0 /100 | #242 | Tragic $44,163 |
| Sub-Saharan Africans | 3.7 /100 | #243 | Tragic $44,118 |
| Immigrants | Nonimmigrants | 3.7 /100 | #244 | Tragic $44,117 |
| Immigrants | Burma/Myanmar | 3.2 /100 | #245 | Tragic $43,998 |
| Immigrants | West Indies | 3.1 /100 | #246 | Tragic $43,989 |
| Immigrants | Cabo Verde | 3.0 /100 | #247 | Tragic $43,963 |
| Nepalese | 2.6 /100 | #248 | Tragic $43,860 |
| Malaysians | 2.6 /100 | #249 | Tragic $43,844 |
| Alaska Natives | 2.3 /100 | #250 | Tragic $43,750 |
| Tsimshian | 2.1 /100 | #251 | Tragic $43,695 |