Celtic vs Tongan Median Earnings
COMPARE
Celtic
Tongan
Median Earnings
Median Earnings Comparison
Celtics
Tongans
$45,732
MEDIAN EARNINGS
27.2/ 100
METRIC RATING
201st/ 347
METRIC RANK
$45,665
MEDIAN EARNINGS
25.4/ 100
METRIC RATING
205th/ 347
METRIC RANK
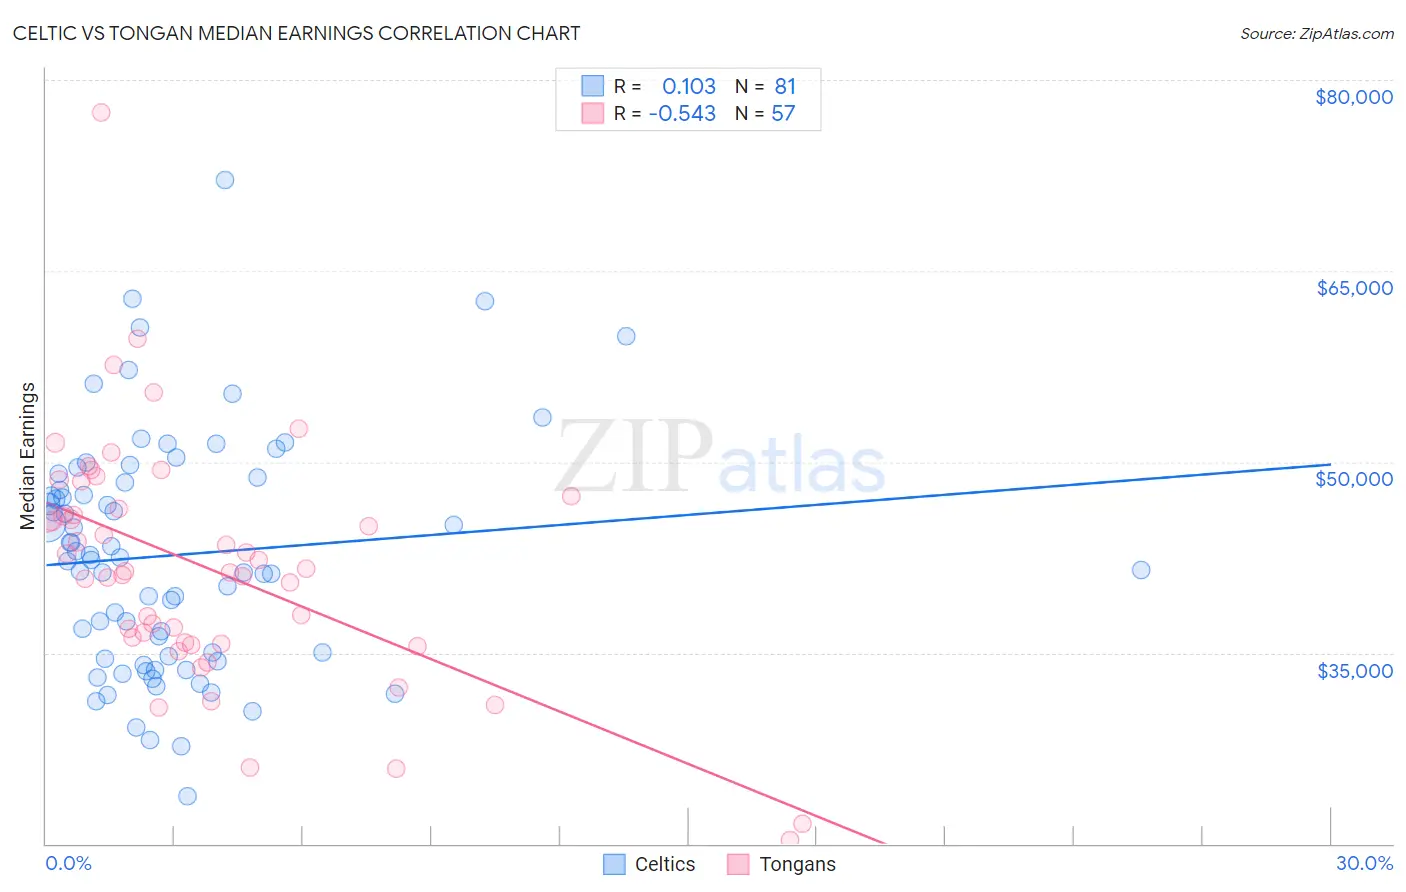
Celtic vs Tongan Median Earnings Correlation Chart
The statistical analysis conducted on geographies consisting of 168,867,558 people shows a poor positive correlation between the proportion of Celtics and median earnings in the United States with a correlation coefficient (R) of 0.103 and weighted average of $45,732. Similarly, the statistical analysis conducted on geographies consisting of 102,906,626 people shows a substantial negative correlation between the proportion of Tongans and median earnings in the United States with a correlation coefficient (R) of -0.543 and weighted average of $45,665, a difference of 0.15%.
Median Earnings Correlation Summary
| Measurement | Celtic | Tongan |
| Minimum | $23,710 | $20,292 |
| Maximum | $72,162 | $77,441 |
| Range | $48,452 | $57,149 |
| Mean | $42,685 | $41,730 |
| Median | $42,318 | $41,421 |
| Interquartile 25% (IQ1) | $34,608 | $35,786 |
| Interquartile 75% (IQ3) | $48,561 | $46,789 |
| Interquartile Range (IQR) | $13,953 | $11,003 |
| Standard Deviation (Sample) | $9,238 | $9,523 |
| Standard Deviation (Population) | $9,181 | $9,439 |
Demographics Similar to Celtics and Tongans by Median Earnings
In terms of median earnings, the demographic groups most similar to Celtics are Immigrants from Trinidad and Tobago ($45,729, a difference of 0.010%), Welsh ($45,710, a difference of 0.050%), Immigrants from Uruguay ($45,682, a difference of 0.11%), Immigrants from Barbados ($45,816, a difference of 0.18%), and Immigrants from the Azores ($45,812, a difference of 0.18%). Similarly, the demographic groups most similar to Tongans are Immigrants from Uruguay ($45,682, a difference of 0.040%), Immigrants from Ghana ($45,641, a difference of 0.050%), Welsh ($45,710, a difference of 0.10%), Immigrants from Senegal ($45,611, a difference of 0.12%), and Immigrants from Trinidad and Tobago ($45,729, a difference of 0.14%).
| Demographics | Rating | Rank | Median Earnings |
| Guamanians/Chamorros | 33.2 /100 | #193 | Fair $45,933 |
| Immigrants | Costa Rica | 33.0 /100 | #194 | Fair $45,928 |
| Immigrants | St. Vincent and the Grenadines | 32.4 /100 | #195 | Fair $45,908 |
| Yugoslavians | 30.5 /100 | #196 | Fair $45,846 |
| Barbadians | 30.5 /100 | #197 | Fair $45,846 |
| Trinidadians and Tobagonians | 29.7 /100 | #198 | Fair $45,820 |
| Immigrants | Barbados | 29.6 /100 | #199 | Fair $45,816 |
| Immigrants | Azores | 29.5 /100 | #200 | Fair $45,812 |
| Celtics | 27.2 /100 | #201 | Fair $45,732 |
| Immigrants | Trinidad and Tobago | 27.1 /100 | #202 | Fair $45,729 |
| Welsh | 26.6 /100 | #203 | Fair $45,710 |
| Immigrants | Uruguay | 25.9 /100 | #204 | Fair $45,682 |
| Tongans | 25.4 /100 | #205 | Fair $45,665 |
| Immigrants | Ghana | 24.8 /100 | #206 | Fair $45,641 |
| Immigrants | Senegal | 24.0 /100 | #207 | Fair $45,611 |
| Immigrants | Bosnia and Herzegovina | 23.7 /100 | #208 | Fair $45,600 |
| Immigrants | Thailand | 23.7 /100 | #209 | Fair $45,598 |
| Immigrants | Grenada | 23.6 /100 | #210 | Fair $45,596 |
| Panamanians | 23.5 /100 | #211 | Fair $45,593 |
| Bermudans | 23.5 /100 | #212 | Fair $45,593 |
| Immigrants | Colombia | 22.4 /100 | #213 | Fair $45,550 |