Celtic vs Immigrants from Somalia Median Earnings
COMPARE
Celtic
Immigrants from Somalia
Median Earnings
Median Earnings Comparison
Celtics
Immigrants from Somalia
$45,732
MEDIAN EARNINGS
27.2/ 100
METRIC RATING
201st/ 347
METRIC RANK
$43,100
MEDIAN EARNINGS
0.9/ 100
METRIC RATING
260th/ 347
METRIC RANK
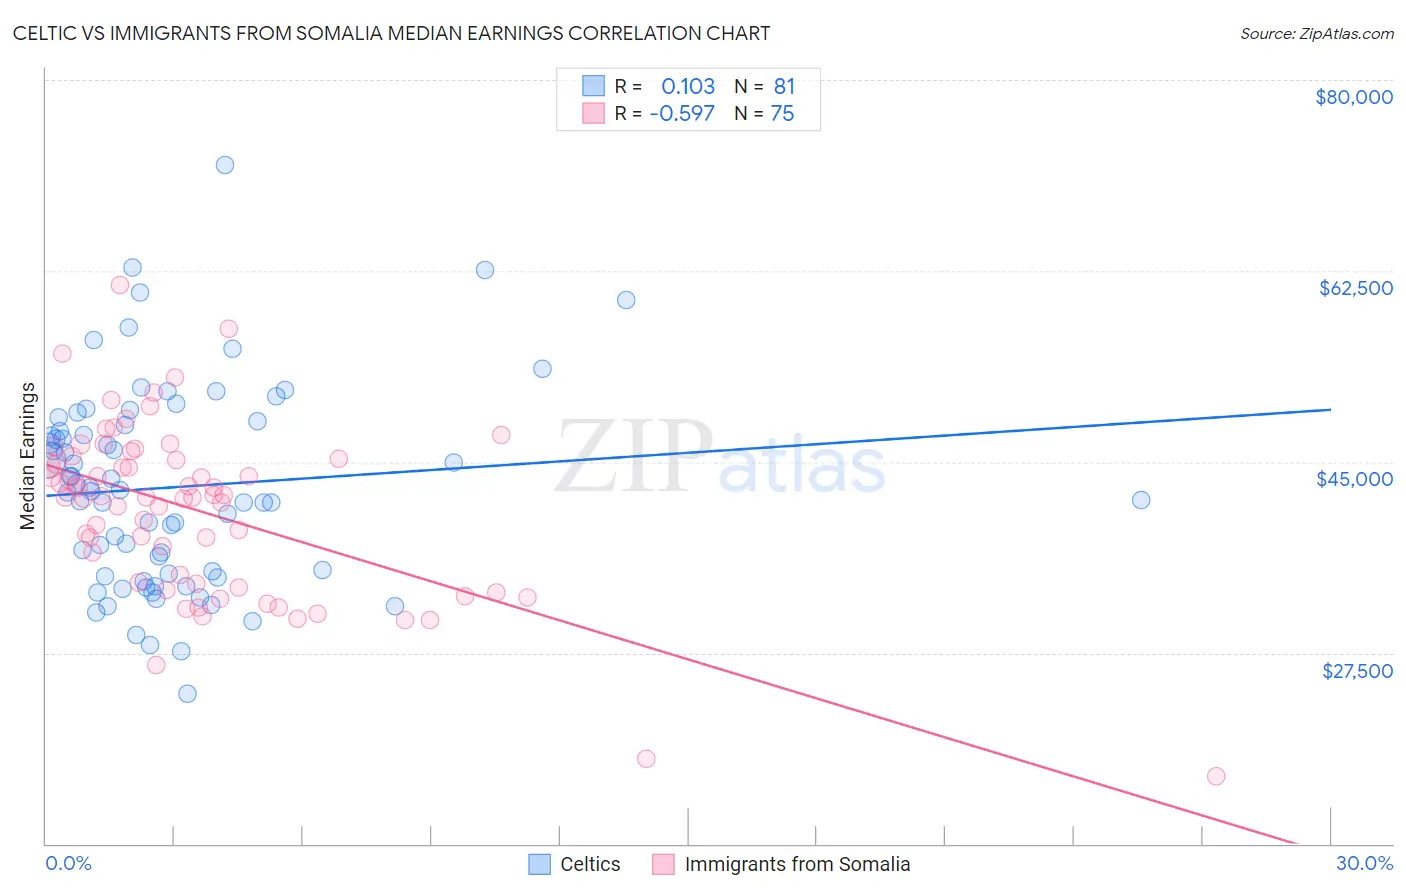
Celtic vs Immigrants from Somalia Median Earnings Correlation Chart
The statistical analysis conducted on geographies consisting of 168,867,558 people shows a poor positive correlation between the proportion of Celtics and median earnings in the United States with a correlation coefficient (R) of 0.103 and weighted average of $45,732. Similarly, the statistical analysis conducted on geographies consisting of 92,110,965 people shows a substantial negative correlation between the proportion of Immigrants from Somalia and median earnings in the United States with a correlation coefficient (R) of -0.597 and weighted average of $43,100, a difference of 6.1%.
Median Earnings Correlation Summary
| Measurement | Celtic | Immigrants from Somalia |
| Minimum | $23,710 | $16,214 |
| Maximum | $72,162 | $61,239 |
| Range | $48,452 | $45,025 |
| Mean | $42,685 | $40,509 |
| Median | $42,318 | $41,780 |
| Interquartile 25% (IQ1) | $34,608 | $33,809 |
| Interquartile 75% (IQ3) | $48,561 | $45,326 |
| Interquartile Range (IQR) | $13,953 | $11,517 |
| Standard Deviation (Sample) | $9,238 | $7,944 |
| Standard Deviation (Population) | $9,181 | $7,891 |
Similar Demographics by Median Earnings
Demographics Similar to Celtics by Median Earnings
In terms of median earnings, the demographic groups most similar to Celtics are Immigrants from Trinidad and Tobago ($45,729, a difference of 0.010%), Welsh ($45,710, a difference of 0.050%), Immigrants from Uruguay ($45,682, a difference of 0.11%), Tongan ($45,665, a difference of 0.15%), and Immigrants from Barbados ($45,816, a difference of 0.18%).
| Demographics | Rating | Rank | Median Earnings |
| Immigrants | Costa Rica | 33.0 /100 | #194 | Fair $45,928 |
| Immigrants | St. Vincent and the Grenadines | 32.4 /100 | #195 | Fair $45,908 |
| Yugoslavians | 30.5 /100 | #196 | Fair $45,846 |
| Barbadians | 30.5 /100 | #197 | Fair $45,846 |
| Trinidadians and Tobagonians | 29.7 /100 | #198 | Fair $45,820 |
| Immigrants | Barbados | 29.6 /100 | #199 | Fair $45,816 |
| Immigrants | Azores | 29.5 /100 | #200 | Fair $45,812 |
| Celtics | 27.2 /100 | #201 | Fair $45,732 |
| Immigrants | Trinidad and Tobago | 27.1 /100 | #202 | Fair $45,729 |
| Welsh | 26.6 /100 | #203 | Fair $45,710 |
| Immigrants | Uruguay | 25.9 /100 | #204 | Fair $45,682 |
| Tongans | 25.4 /100 | #205 | Fair $45,665 |
| Immigrants | Ghana | 24.8 /100 | #206 | Fair $45,641 |
| Immigrants | Senegal | 24.0 /100 | #207 | Fair $45,611 |
| Immigrants | Bosnia and Herzegovina | 23.7 /100 | #208 | Fair $45,600 |
Demographics Similar to Immigrants from Somalia by Median Earnings
In terms of median earnings, the demographic groups most similar to Immigrants from Somalia are Immigrants from Jamaica ($43,026, a difference of 0.17%), Nicaraguan ($43,026, a difference of 0.17%), German Russian ($43,200, a difference of 0.23%), Inupiat ($43,000, a difference of 0.23%), and Immigrants from Liberia ($42,923, a difference of 0.41%).
| Demographics | Rating | Rank | Median Earnings |
| Somalis | 1.8 /100 | #253 | Tragic $43,567 |
| Liberians | 1.7 /100 | #254 | Tragic $43,536 |
| Immigrants | Middle Africa | 1.4 /100 | #255 | Tragic $43,416 |
| Alaskan Athabascans | 1.4 /100 | #256 | Tragic $43,393 |
| Jamaicans | 1.3 /100 | #257 | Tragic $43,343 |
| French American Indians | 1.3 /100 | #258 | Tragic $43,333 |
| German Russians | 1.1 /100 | #259 | Tragic $43,200 |
| Immigrants | Somalia | 0.9 /100 | #260 | Tragic $43,100 |
| Immigrants | Jamaica | 0.8 /100 | #261 | Tragic $43,026 |
| Nicaraguans | 0.8 /100 | #262 | Tragic $43,026 |
| Inupiat | 0.8 /100 | #263 | Tragic $43,000 |
| Immigrants | Liberia | 0.7 /100 | #264 | Tragic $42,923 |
| Salvadorans | 0.7 /100 | #265 | Tragic $42,912 |
| Immigrants | Laos | 0.7 /100 | #266 | Tragic $42,884 |
| Cree | 0.6 /100 | #267 | Tragic $42,777 |