Celtic vs Syrian Median Earnings
COMPARE
Celtic
Syrian
Median Earnings
Median Earnings Comparison
Celtics
Syrians
$45,732
MEDIAN EARNINGS
27.2/ 100
METRIC RATING
201st/ 347
METRIC RANK
$48,934
MEDIAN EARNINGS
97.1/ 100
METRIC RATING
109th/ 347
METRIC RANK
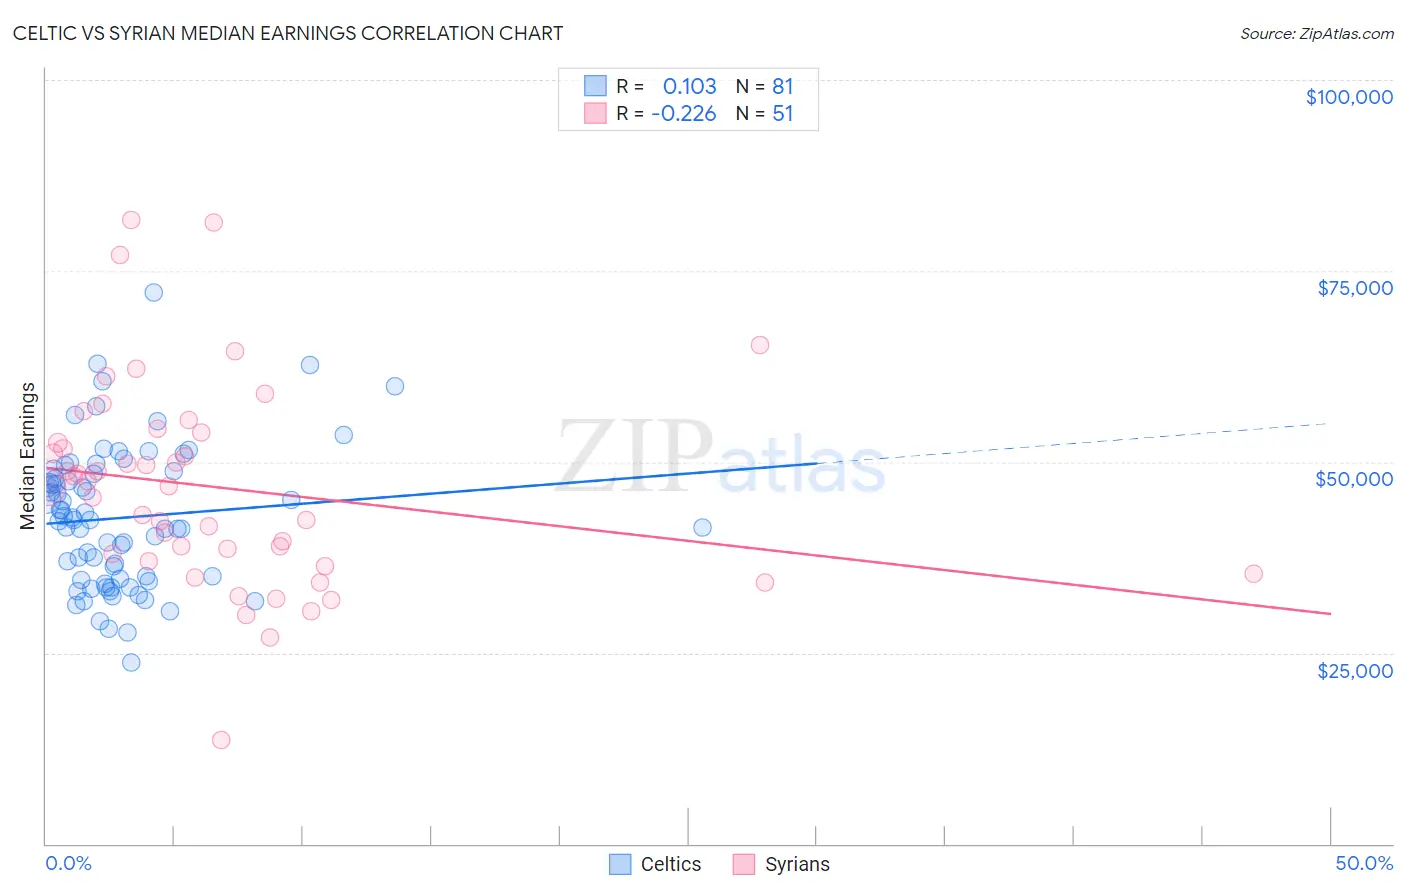
Celtic vs Syrian Median Earnings Correlation Chart
The statistical analysis conducted on geographies consisting of 168,867,558 people shows a poor positive correlation between the proportion of Celtics and median earnings in the United States with a correlation coefficient (R) of 0.103 and weighted average of $45,732. Similarly, the statistical analysis conducted on geographies consisting of 266,312,508 people shows a weak negative correlation between the proportion of Syrians and median earnings in the United States with a correlation coefficient (R) of -0.226 and weighted average of $48,934, a difference of 7.0%.
Median Earnings Correlation Summary
| Measurement | Celtic | Syrian |
| Minimum | $23,710 | $13,611 |
| Maximum | $72,162 | $81,610 |
| Range | $48,452 | $67,999 |
| Mean | $42,685 | $46,643 |
| Median | $42,318 | $46,804 |
| Interquartile 25% (IQ1) | $34,608 | $37,007 |
| Interquartile 75% (IQ3) | $48,561 | $53,802 |
| Interquartile Range (IQR) | $13,953 | $16,795 |
| Standard Deviation (Sample) | $9,238 | $13,425 |
| Standard Deviation (Population) | $9,181 | $13,293 |
Similar Demographics by Median Earnings
Demographics Similar to Celtics by Median Earnings
In terms of median earnings, the demographic groups most similar to Celtics are Immigrants from Trinidad and Tobago ($45,729, a difference of 0.010%), Welsh ($45,710, a difference of 0.050%), Immigrants from Uruguay ($45,682, a difference of 0.11%), Tongan ($45,665, a difference of 0.15%), and Immigrants from Barbados ($45,816, a difference of 0.18%).
| Demographics | Rating | Rank | Median Earnings |
| Immigrants | Costa Rica | 33.0 /100 | #194 | Fair $45,928 |
| Immigrants | St. Vincent and the Grenadines | 32.4 /100 | #195 | Fair $45,908 |
| Yugoslavians | 30.5 /100 | #196 | Fair $45,846 |
| Barbadians | 30.5 /100 | #197 | Fair $45,846 |
| Trinidadians and Tobagonians | 29.7 /100 | #198 | Fair $45,820 |
| Immigrants | Barbados | 29.6 /100 | #199 | Fair $45,816 |
| Immigrants | Azores | 29.5 /100 | #200 | Fair $45,812 |
| Celtics | 27.2 /100 | #201 | Fair $45,732 |
| Immigrants | Trinidad and Tobago | 27.1 /100 | #202 | Fair $45,729 |
| Welsh | 26.6 /100 | #203 | Fair $45,710 |
| Immigrants | Uruguay | 25.9 /100 | #204 | Fair $45,682 |
| Tongans | 25.4 /100 | #205 | Fair $45,665 |
| Immigrants | Ghana | 24.8 /100 | #206 | Fair $45,641 |
| Immigrants | Senegal | 24.0 /100 | #207 | Fair $45,611 |
| Immigrants | Bosnia and Herzegovina | 23.7 /100 | #208 | Fair $45,600 |
Demographics Similar to Syrians by Median Earnings
In terms of median earnings, the demographic groups most similar to Syrians are Immigrants from Ethiopia ($48,924, a difference of 0.020%), Immigrants from Zimbabwe ($48,913, a difference of 0.040%), Northern European ($48,887, a difference of 0.10%), Immigrants from Kuwait ($48,861, a difference of 0.15%), and Moroccan ($48,838, a difference of 0.20%).
| Demographics | Rating | Rank | Median Earnings |
| Ethiopians | 98.8 /100 | #102 | Exceptional $49,572 |
| Austrians | 98.7 /100 | #103 | Exceptional $49,501 |
| Immigrants | Brazil | 98.6 /100 | #104 | Exceptional $49,463 |
| Immigrants | Western Asia | 98.4 /100 | #105 | Exceptional $49,389 |
| Immigrants | Albania | 98.4 /100 | #106 | Exceptional $49,377 |
| Immigrants | Morocco | 98.4 /100 | #107 | Exceptional $49,368 |
| Palestinians | 98.0 /100 | #108 | Exceptional $49,209 |
| Syrians | 97.1 /100 | #109 | Exceptional $48,934 |
| Immigrants | Ethiopia | 97.1 /100 | #110 | Exceptional $48,924 |
| Immigrants | Zimbabwe | 97.0 /100 | #111 | Exceptional $48,913 |
| Northern Europeans | 96.9 /100 | #112 | Exceptional $48,887 |
| Immigrants | Kuwait | 96.8 /100 | #113 | Exceptional $48,861 |
| Moroccans | 96.7 /100 | #114 | Exceptional $48,838 |
| Chinese | 96.7 /100 | #115 | Exceptional $48,836 |
| Koreans | 96.2 /100 | #116 | Exceptional $48,727 |