Austrian vs Immigrants from West Indies Median Male Earnings
COMPARE
Austrian
Immigrants from West Indies
Median Male Earnings
Median Male Earnings Comparison
Austrians
Immigrants from West Indies
$59,359
MEDIAN MALE EARNINGS
99.2/ 100
METRIC RATING
90th/ 347
METRIC RANK
$49,271
MEDIAN MALE EARNINGS
0.6/ 100
METRIC RATING
262nd/ 347
METRIC RANK
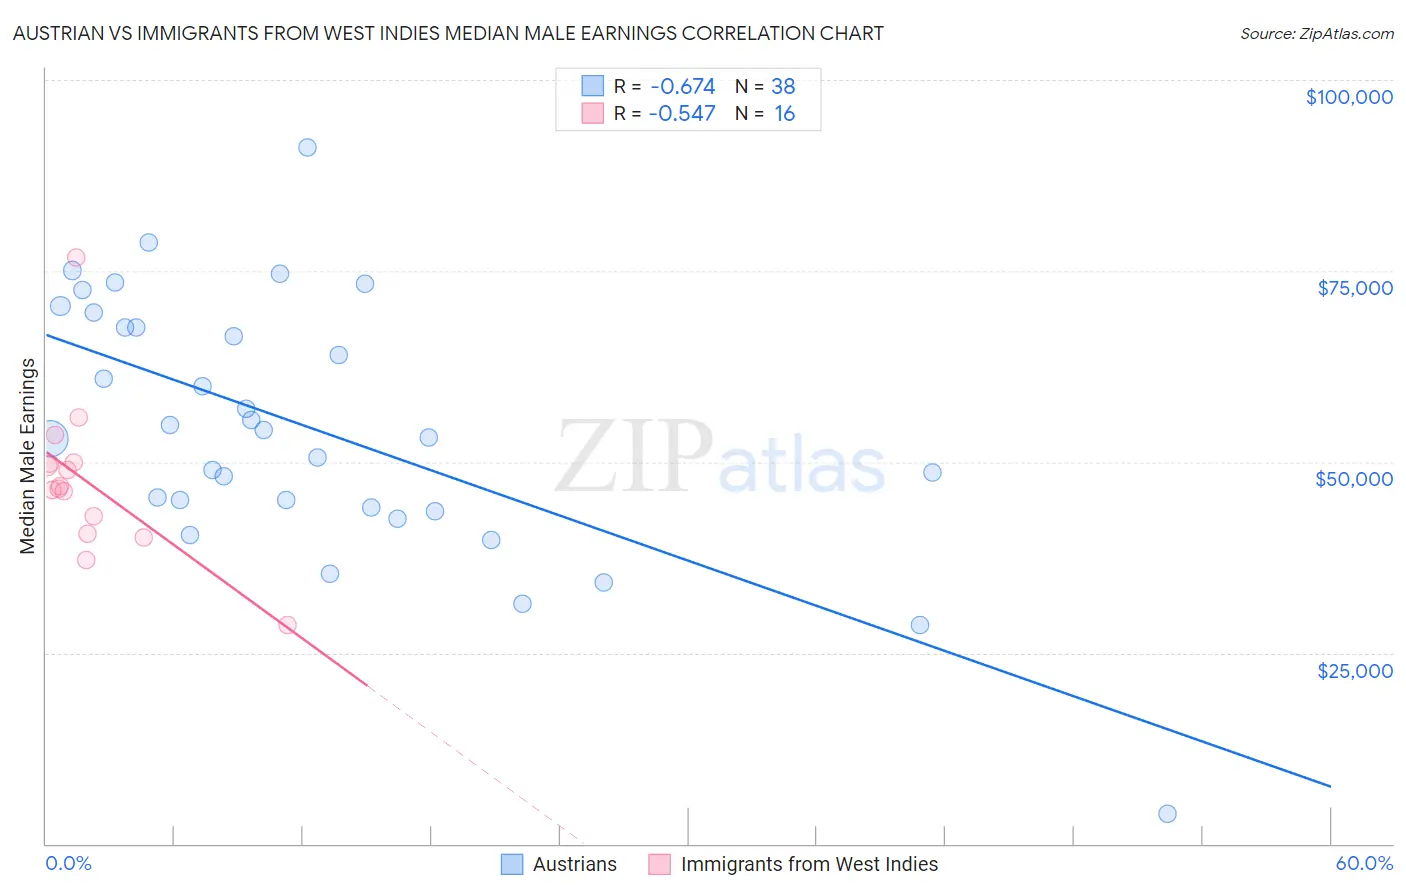
Austrian vs Immigrants from West Indies Median Male Earnings Correlation Chart
The statistical analysis conducted on geographies consisting of 451,854,520 people shows a significant negative correlation between the proportion of Austrians and median male earnings in the United States with a correlation coefficient (R) of -0.674 and weighted average of $59,359. Similarly, the statistical analysis conducted on geographies consisting of 72,416,935 people shows a substantial negative correlation between the proportion of Immigrants from West Indies and median male earnings in the United States with a correlation coefficient (R) of -0.547 and weighted average of $49,271, a difference of 20.5%.
Median Male Earnings Correlation Summary
| Measurement | Austrian | Immigrants from West Indies |
| Minimum | $3,902 | $28,702 |
| Maximum | $91,143 | $76,711 |
| Range | $87,241 | $48,009 |
| Mean | $54,430 | $47,473 |
| Median | $53,632 | $46,662 |
| Interquartile 25% (IQ1) | $43,967 | $41,722 |
| Interquartile 75% (IQ3) | $67,629 | $49,852 |
| Interquartile Range (IQR) | $23,662 | $8,130 |
| Standard Deviation (Sample) | $16,958 | $10,214 |
| Standard Deviation (Population) | $16,734 | $9,890 |
Similar Demographics by Median Male Earnings
Demographics Similar to Austrians by Median Male Earnings
In terms of median male earnings, the demographic groups most similar to Austrians are Laotian ($59,351, a difference of 0.010%), Immigrants from Moldova ($59,417, a difference of 0.10%), Immigrants from Kazakhstan ($59,278, a difference of 0.14%), Immigrants from Argentina ($59,491, a difference of 0.22%), and Immigrants from Southern Europe ($59,217, a difference of 0.24%).
| Demographics | Rating | Rank | Median Male Earnings |
| Immigrants | Italy | 99.4 /100 | #83 | Exceptional $59,691 |
| Afghans | 99.3 /100 | #84 | Exceptional $59,554 |
| Italians | 99.3 /100 | #85 | Exceptional $59,551 |
| Immigrants | England | 99.3 /100 | #86 | Exceptional $59,527 |
| Macedonians | 99.3 /100 | #87 | Exceptional $59,522 |
| Immigrants | Argentina | 99.3 /100 | #88 | Exceptional $59,491 |
| Immigrants | Moldova | 99.2 /100 | #89 | Exceptional $59,417 |
| Austrians | 99.2 /100 | #90 | Exceptional $59,359 |
| Laotians | 99.2 /100 | #91 | Exceptional $59,351 |
| Immigrants | Kazakhstan | 99.1 /100 | #92 | Exceptional $59,278 |
| Immigrants | Southern Europe | 99.0 /100 | #93 | Exceptional $59,217 |
| Immigrants | North Macedonia | 99.0 /100 | #94 | Exceptional $59,189 |
| Immigrants | Lebanon | 98.6 /100 | #95 | Exceptional $58,835 |
| Albanians | 98.4 /100 | #96 | Exceptional $58,680 |
| Northern Europeans | 98.2 /100 | #97 | Exceptional $58,588 |
Demographics Similar to Immigrants from West Indies by Median Male Earnings
In terms of median male earnings, the demographic groups most similar to Immigrants from West Indies are Liberian ($49,318, a difference of 0.10%), Nicaraguan ($49,215, a difference of 0.11%), Immigrants from Middle Africa ($49,201, a difference of 0.14%), Immigrants from Laos ($49,190, a difference of 0.16%), and Iroquois ($49,374, a difference of 0.21%).
| Demographics | Rating | Rank | Median Male Earnings |
| Alaskan Athabascans | 0.9 /100 | #255 | Tragic $49,748 |
| Alaska Natives | 0.9 /100 | #256 | Tragic $49,711 |
| British West Indians | 0.8 /100 | #257 | Tragic $49,636 |
| Cree | 0.7 /100 | #258 | Tragic $49,497 |
| Nepalese | 0.7 /100 | #259 | Tragic $49,458 |
| Iroquois | 0.7 /100 | #260 | Tragic $49,374 |
| Liberians | 0.6 /100 | #261 | Tragic $49,318 |
| Immigrants | West Indies | 0.6 /100 | #262 | Tragic $49,271 |
| Nicaraguans | 0.6 /100 | #263 | Tragic $49,215 |
| Immigrants | Middle Africa | 0.6 /100 | #264 | Tragic $49,201 |
| Immigrants | Laos | 0.6 /100 | #265 | Tragic $49,190 |
| Somalis | 0.5 /100 | #266 | Tragic $49,025 |
| Spanish Americans | 0.5 /100 | #267 | Tragic $49,008 |
| Ute | 0.4 /100 | #268 | Tragic $48,899 |
| Tsimshian | 0.4 /100 | #269 | Tragic $48,836 |