Austrian vs Immigrants from West Indies 6th Grade
COMPARE
Austrian
Immigrants from West Indies
6th Grade
6th Grade Comparison
Austrians
Immigrants from West Indies
97.7%
6TH GRADE
99.8/ 100
METRIC RATING
56th/ 347
METRIC RANK
96.1%
6TH GRADE
0.0/ 100
METRIC RATING
293rd/ 347
METRIC RANK
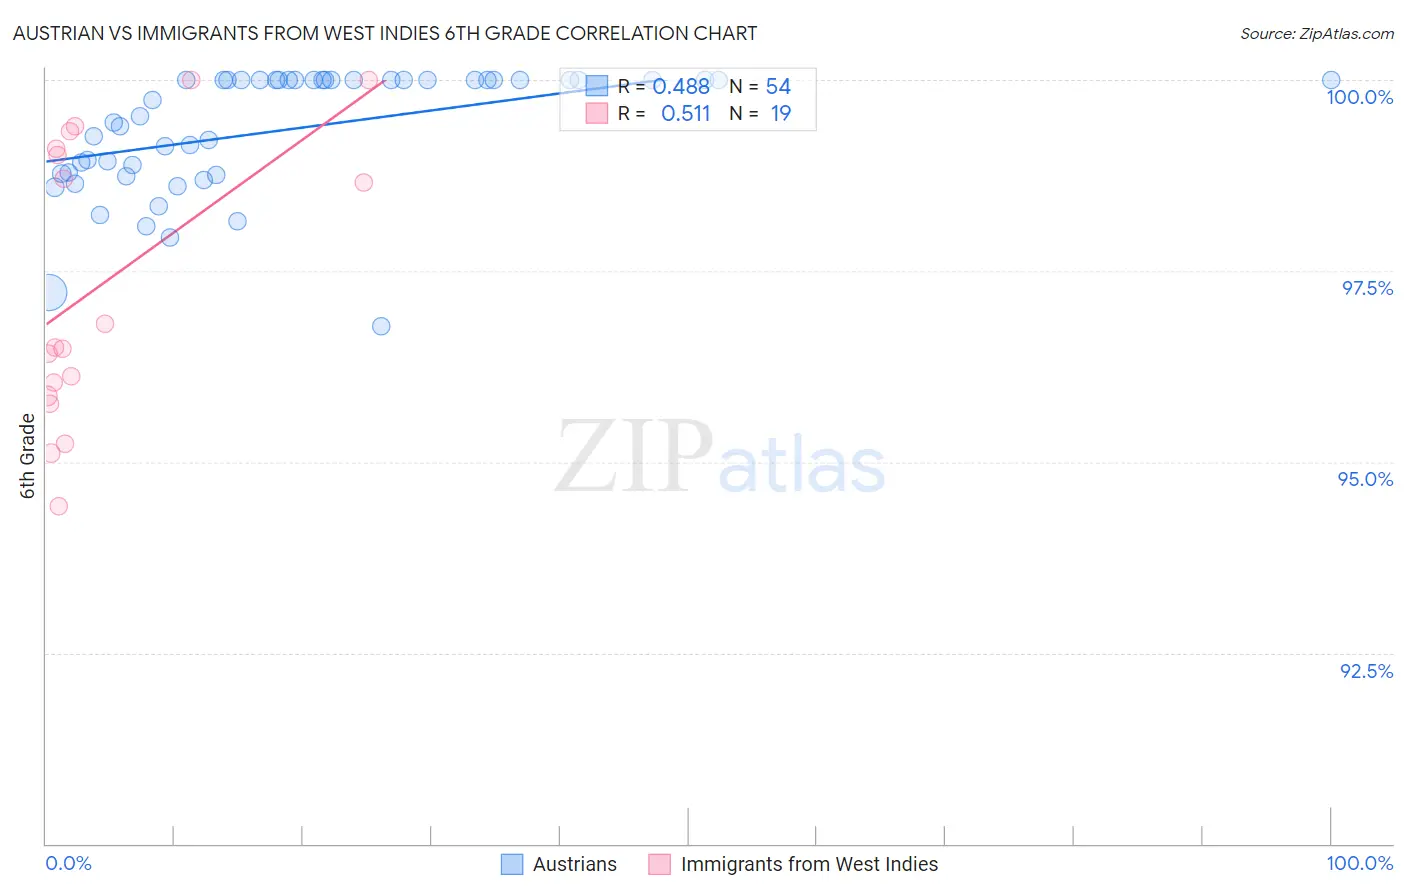
Austrian vs Immigrants from West Indies 6th Grade Correlation Chart
The statistical analysis conducted on geographies consisting of 452,080,536 people shows a moderate positive correlation between the proportion of Austrians and percentage of population with at least 6th grade education in the United States with a correlation coefficient (R) of 0.488 and weighted average of 97.7%. Similarly, the statistical analysis conducted on geographies consisting of 72,457,514 people shows a substantial positive correlation between the proportion of Immigrants from West Indies and percentage of population with at least 6th grade education in the United States with a correlation coefficient (R) of 0.511 and weighted average of 96.1%, a difference of 1.7%.
6th Grade Correlation Summary
| Measurement | Austrian | Immigrants from West Indies |
| Minimum | 96.8% | 94.4% |
| Maximum | 100.0% | 100.0% |
| Range | 3.2% | 5.6% |
| Mean | 99.4% | 97.3% |
| Median | 99.9% | 96.5% |
| Interquartile 25% (IQ1) | 98.8% | 95.9% |
| Interquartile 75% (IQ3) | 100.0% | 99.1% |
| Interquartile Range (IQR) | 1.2% | 3.2% |
| Standard Deviation (Sample) | 0.80% | 1.8% |
| Standard Deviation (Population) | 0.80% | 1.8% |
Similar Demographics by 6th Grade
Demographics Similar to Austrians by 6th Grade
In terms of 6th grade, the demographic groups most similar to Austrians are Creek (97.7%, a difference of 0.010%), Aleut (97.7%, a difference of 0.010%), White/Caucasian (97.7%, a difference of 0.010%), Greek (97.7%, a difference of 0.010%), and Maltese (97.8%, a difference of 0.020%).
| Demographics | Rating | Rank | 6th Grade |
| Estonians | 99.8 /100 | #49 | Exceptional 97.8% |
| Immigrants | Scotland | 99.8 /100 | #50 | Exceptional 97.8% |
| Maltese | 99.8 /100 | #51 | Exceptional 97.8% |
| Australians | 99.8 /100 | #52 | Exceptional 97.8% |
| Slavs | 99.8 /100 | #53 | Exceptional 97.8% |
| Creek | 99.8 /100 | #54 | Exceptional 97.7% |
| Aleuts | 99.8 /100 | #55 | Exceptional 97.7% |
| Austrians | 99.8 /100 | #56 | Exceptional 97.7% |
| Whites/Caucasians | 99.8 /100 | #57 | Exceptional 97.7% |
| Greeks | 99.8 /100 | #58 | Exceptional 97.7% |
| Americans | 99.8 /100 | #59 | Exceptional 97.7% |
| Immigrants | Canada | 99.8 /100 | #60 | Exceptional 97.7% |
| Serbians | 99.7 /100 | #61 | Exceptional 97.7% |
| Immigrants | North America | 99.7 /100 | #62 | Exceptional 97.7% |
| Russians | 99.7 /100 | #63 | Exceptional 97.7% |
Demographics Similar to Immigrants from West Indies by 6th Grade
In terms of 6th grade, the demographic groups most similar to Immigrants from West Indies are Immigrants from Barbados (96.1%, a difference of 0.040%), Immigrants from Somalia (96.1%, a difference of 0.060%), Immigrants from St. Vincent and the Grenadines (96.1%, a difference of 0.060%), British West Indian (96.0%, a difference of 0.070%), and Immigrants from Eritrea (96.1%, a difference of 0.080%).
| Demographics | Rating | Rank | 6th Grade |
| Barbadians | 0.0 /100 | #286 | Tragic 96.2% |
| Immigrants | Trinidad and Tobago | 0.0 /100 | #287 | Tragic 96.2% |
| Malaysians | 0.0 /100 | #288 | Tragic 96.2% |
| Immigrants | Eritrea | 0.0 /100 | #289 | Tragic 96.1% |
| Immigrants | Somalia | 0.0 /100 | #290 | Tragic 96.1% |
| Immigrants | St. Vincent and the Grenadines | 0.0 /100 | #291 | Tragic 96.1% |
| Immigrants | Barbados | 0.0 /100 | #292 | Tragic 96.1% |
| Immigrants | West Indies | 0.0 /100 | #293 | Tragic 96.1% |
| British West Indians | 0.0 /100 | #294 | Tragic 96.0% |
| Immigrants | Grenada | 0.0 /100 | #295 | Tragic 95.9% |
| Immigrants | South Eastern Asia | 0.0 /100 | #296 | Tragic 95.9% |
| Haitians | 0.0 /100 | #297 | Tragic 95.8% |
| Sri Lankans | 0.0 /100 | #298 | Tragic 95.8% |
| Immigrants | Laos | 0.0 /100 | #299 | Tragic 95.7% |
| Immigrants | Dominica | 0.0 /100 | #300 | Tragic 95.7% |