Basque vs Immigrants from West Indies Median Male Earnings
COMPARE
Basque
Immigrants from West Indies
Median Male Earnings
Median Male Earnings Comparison
Basques
Immigrants from West Indies
$55,370
MEDIAN MALE EARNINGS
70.3/ 100
METRIC RATING
160th/ 347
METRIC RANK
$49,271
MEDIAN MALE EARNINGS
0.6/ 100
METRIC RATING
262nd/ 347
METRIC RANK
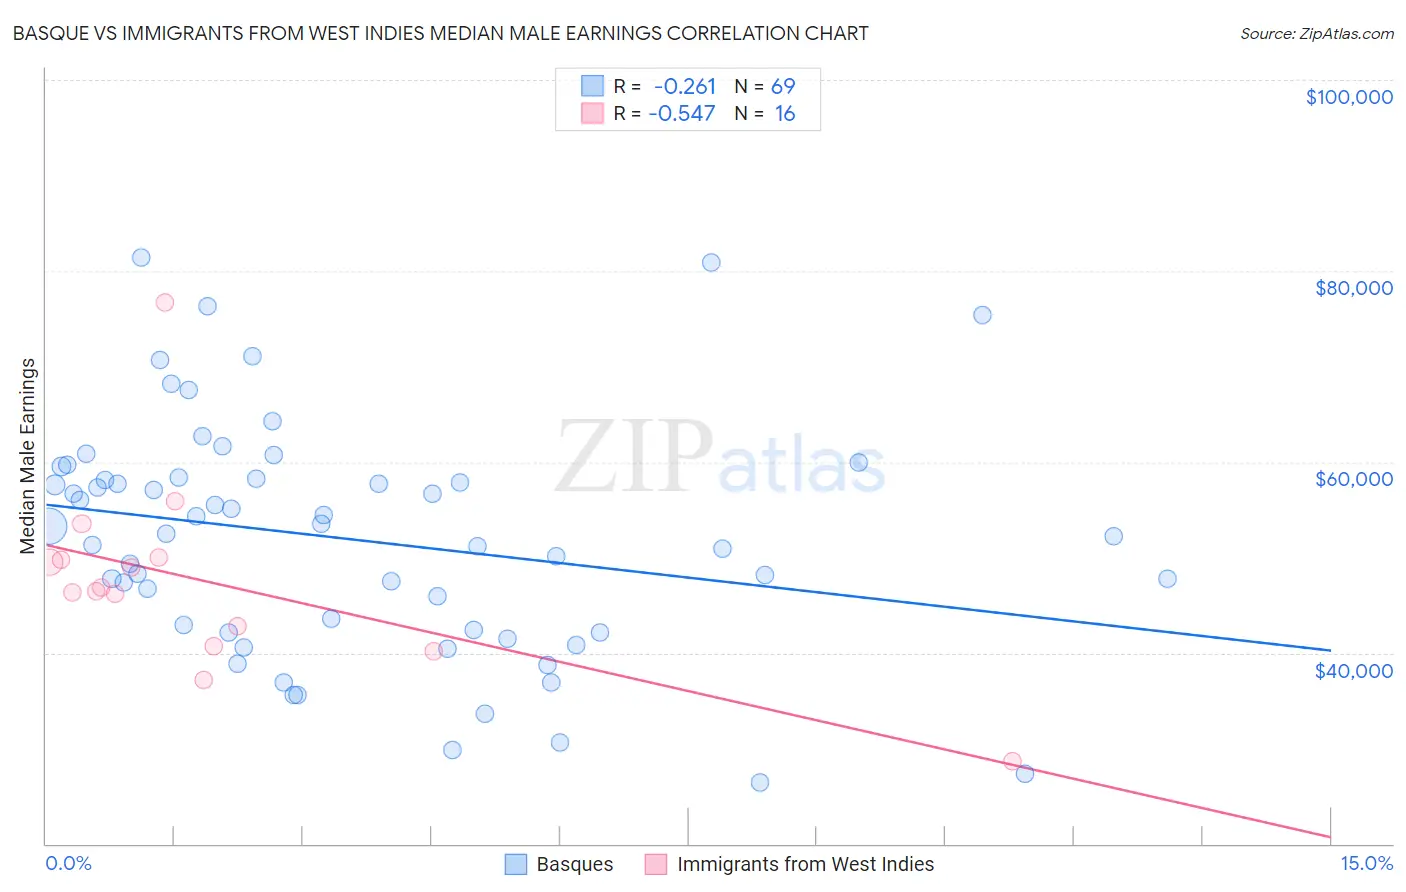
Basque vs Immigrants from West Indies Median Male Earnings Correlation Chart
The statistical analysis conducted on geographies consisting of 165,750,902 people shows a weak negative correlation between the proportion of Basques and median male earnings in the United States with a correlation coefficient (R) of -0.261 and weighted average of $55,370. Similarly, the statistical analysis conducted on geographies consisting of 72,416,935 people shows a substantial negative correlation between the proportion of Immigrants from West Indies and median male earnings in the United States with a correlation coefficient (R) of -0.547 and weighted average of $49,271, a difference of 12.4%.
Median Male Earnings Correlation Summary
| Measurement | Basque | Immigrants from West Indies |
| Minimum | $26,442 | $28,702 |
| Maximum | $81,428 | $76,711 |
| Range | $54,986 | $48,009 |
| Mean | $51,886 | $47,473 |
| Median | $52,492 | $46,662 |
| Interquartile 25% (IQ1) | $42,224 | $41,722 |
| Interquartile 75% (IQ3) | $58,280 | $49,852 |
| Interquartile Range (IQR) | $16,056 | $8,130 |
| Standard Deviation (Sample) | $12,223 | $10,214 |
| Standard Deviation (Population) | $12,134 | $9,890 |
Similar Demographics by Median Male Earnings
Demographics Similar to Basques by Median Male Earnings
In terms of median male earnings, the demographic groups most similar to Basques are Czechoslovakian ($55,382, a difference of 0.020%), Alsatian ($55,380, a difference of 0.020%), Belgian ($55,361, a difference of 0.020%), French ($55,350, a difference of 0.040%), and Icelander ($55,415, a difference of 0.080%).
| Demographics | Rating | Rank | Median Male Earnings |
| Immigrants | Nepal | 75.0 /100 | #153 | Good $55,615 |
| Taiwanese | 73.9 /100 | #154 | Good $55,556 |
| Scandinavians | 73.4 /100 | #155 | Good $55,527 |
| Immigrants | Ethiopia | 71.6 /100 | #156 | Good $55,434 |
| Icelanders | 71.2 /100 | #157 | Good $55,415 |
| Czechoslovakians | 70.5 /100 | #158 | Good $55,382 |
| Alsatians | 70.5 /100 | #159 | Good $55,380 |
| Basques | 70.3 /100 | #160 | Good $55,370 |
| Belgians | 70.1 /100 | #161 | Good $55,361 |
| French | 69.9 /100 | #162 | Good $55,350 |
| Ugandans | 68.6 /100 | #163 | Good $55,290 |
| Immigrants | South Eastern Asia | 67.6 /100 | #164 | Good $55,241 |
| Immigrants | Portugal | 66.3 /100 | #165 | Good $55,182 |
| Germans | 61.6 /100 | #166 | Good $54,974 |
| Immigrants | Fiji | 61.2 /100 | #167 | Good $54,958 |
Demographics Similar to Immigrants from West Indies by Median Male Earnings
In terms of median male earnings, the demographic groups most similar to Immigrants from West Indies are Liberian ($49,318, a difference of 0.10%), Nicaraguan ($49,215, a difference of 0.11%), Immigrants from Middle Africa ($49,201, a difference of 0.14%), Immigrants from Laos ($49,190, a difference of 0.16%), and Iroquois ($49,374, a difference of 0.21%).
| Demographics | Rating | Rank | Median Male Earnings |
| Alaskan Athabascans | 0.9 /100 | #255 | Tragic $49,748 |
| Alaska Natives | 0.9 /100 | #256 | Tragic $49,711 |
| British West Indians | 0.8 /100 | #257 | Tragic $49,636 |
| Cree | 0.7 /100 | #258 | Tragic $49,497 |
| Nepalese | 0.7 /100 | #259 | Tragic $49,458 |
| Iroquois | 0.7 /100 | #260 | Tragic $49,374 |
| Liberians | 0.6 /100 | #261 | Tragic $49,318 |
| Immigrants | West Indies | 0.6 /100 | #262 | Tragic $49,271 |
| Nicaraguans | 0.6 /100 | #263 | Tragic $49,215 |
| Immigrants | Middle Africa | 0.6 /100 | #264 | Tragic $49,201 |
| Immigrants | Laos | 0.6 /100 | #265 | Tragic $49,190 |
| Somalis | 0.5 /100 | #266 | Tragic $49,025 |
| Spanish Americans | 0.5 /100 | #267 | Tragic $49,008 |
| Ute | 0.4 /100 | #268 | Tragic $48,899 |
| Tsimshian | 0.4 /100 | #269 | Tragic $48,836 |