Austrian vs Central American Median Male Earnings
COMPARE
Austrian
Central American
Median Male Earnings
Median Male Earnings Comparison
Austrians
Central Americans
$59,359
MEDIAN MALE EARNINGS
99.2/ 100
METRIC RATING
90th/ 347
METRIC RANK
$48,093
MEDIAN MALE EARNINGS
0.2/ 100
METRIC RATING
282nd/ 347
METRIC RANK
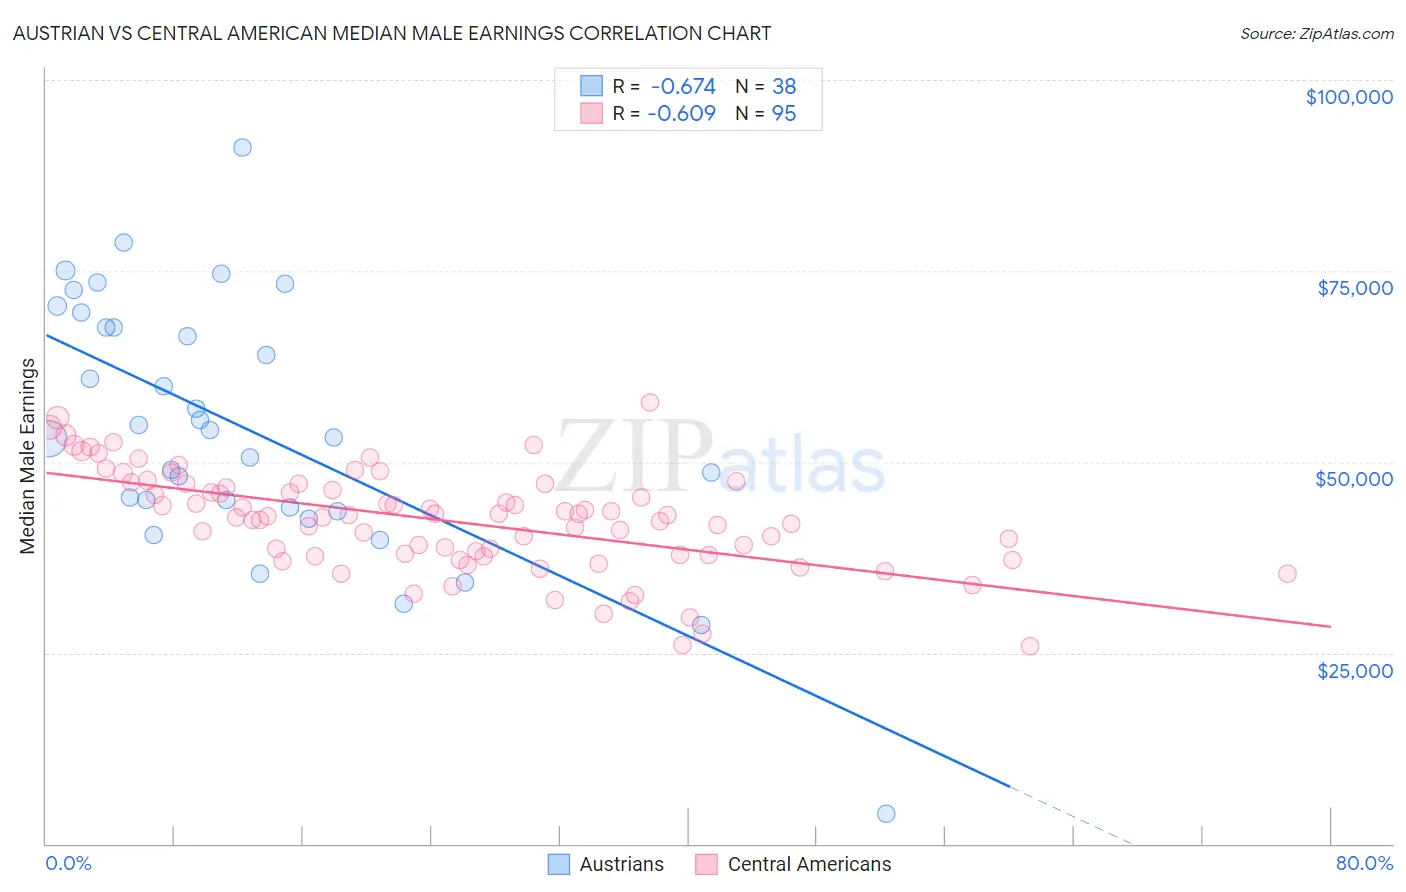
Austrian vs Central American Median Male Earnings Correlation Chart
The statistical analysis conducted on geographies consisting of 451,854,520 people shows a significant negative correlation between the proportion of Austrians and median male earnings in the United States with a correlation coefficient (R) of -0.674 and weighted average of $59,359. Similarly, the statistical analysis conducted on geographies consisting of 504,312,553 people shows a significant negative correlation between the proportion of Central Americans and median male earnings in the United States with a correlation coefficient (R) of -0.609 and weighted average of $48,093, a difference of 23.4%.
Median Male Earnings Correlation Summary
| Measurement | Austrian | Central American |
| Minimum | $3,902 | $25,893 |
| Maximum | $91,143 | $57,715 |
| Range | $87,241 | $31,822 |
| Mean | $54,430 | $42,312 |
| Median | $53,632 | $42,955 |
| Interquartile 25% (IQ1) | $43,967 | $37,781 |
| Interquartile 75% (IQ3) | $67,629 | $47,084 |
| Interquartile Range (IQR) | $23,662 | $9,303 |
| Standard Deviation (Sample) | $16,958 | $6,615 |
| Standard Deviation (Population) | $16,734 | $6,580 |
Similar Demographics by Median Male Earnings
Demographics Similar to Austrians by Median Male Earnings
In terms of median male earnings, the demographic groups most similar to Austrians are Laotian ($59,351, a difference of 0.010%), Immigrants from Moldova ($59,417, a difference of 0.10%), Immigrants from Kazakhstan ($59,278, a difference of 0.14%), Immigrants from Argentina ($59,491, a difference of 0.22%), and Immigrants from Southern Europe ($59,217, a difference of 0.24%).
| Demographics | Rating | Rank | Median Male Earnings |
| Immigrants | Italy | 99.4 /100 | #83 | Exceptional $59,691 |
| Afghans | 99.3 /100 | #84 | Exceptional $59,554 |
| Italians | 99.3 /100 | #85 | Exceptional $59,551 |
| Immigrants | England | 99.3 /100 | #86 | Exceptional $59,527 |
| Macedonians | 99.3 /100 | #87 | Exceptional $59,522 |
| Immigrants | Argentina | 99.3 /100 | #88 | Exceptional $59,491 |
| Immigrants | Moldova | 99.2 /100 | #89 | Exceptional $59,417 |
| Austrians | 99.2 /100 | #90 | Exceptional $59,359 |
| Laotians | 99.2 /100 | #91 | Exceptional $59,351 |
| Immigrants | Kazakhstan | 99.1 /100 | #92 | Exceptional $59,278 |
| Immigrants | Southern Europe | 99.0 /100 | #93 | Exceptional $59,217 |
| Immigrants | North Macedonia | 99.0 /100 | #94 | Exceptional $59,189 |
| Immigrants | Lebanon | 98.6 /100 | #95 | Exceptional $58,835 |
| Albanians | 98.4 /100 | #96 | Exceptional $58,680 |
| Northern Europeans | 98.2 /100 | #97 | Exceptional $58,588 |
Demographics Similar to Central Americans by Median Male Earnings
In terms of median male earnings, the demographic groups most similar to Central Americans are Marshallese ($48,137, a difference of 0.090%), Immigrants from Jamaica ($48,040, a difference of 0.11%), African ($47,994, a difference of 0.21%), Paiute ($47,991, a difference of 0.21%), and Mexican American Indian ($47,990, a difference of 0.22%).
| Demographics | Rating | Rank | Median Male Earnings |
| Immigrants | Somalia | 0.3 /100 | #275 | Tragic $48,439 |
| Blackfeet | 0.3 /100 | #276 | Tragic $48,402 |
| Belizeans | 0.2 /100 | #277 | Tragic $48,358 |
| Immigrants | Liberia | 0.2 /100 | #278 | Tragic $48,317 |
| Hmong | 0.2 /100 | #279 | Tragic $48,254 |
| Comanche | 0.2 /100 | #280 | Tragic $48,202 |
| Marshallese | 0.2 /100 | #281 | Tragic $48,137 |
| Central Americans | 0.2 /100 | #282 | Tragic $48,093 |
| Immigrants | Jamaica | 0.2 /100 | #283 | Tragic $48,040 |
| Africans | 0.2 /100 | #284 | Tragic $47,994 |
| Paiute | 0.2 /100 | #285 | Tragic $47,991 |
| Mexican American Indians | 0.2 /100 | #286 | Tragic $47,990 |
| Immigrants | El Salvador | 0.2 /100 | #287 | Tragic $47,973 |
| Shoshone | 0.2 /100 | #288 | Tragic $47,930 |
| Chickasaw | 0.1 /100 | #289 | Tragic $47,832 |