Austrian vs Puerto Rican Median Male Earnings
COMPARE
Austrian
Puerto Rican
Median Male Earnings
Median Male Earnings Comparison
Austrians
Puerto Ricans
$59,359
MEDIAN MALE EARNINGS
99.2/ 100
METRIC RATING
90th/ 347
METRIC RANK
$40,071
MEDIAN MALE EARNINGS
0.0/ 100
METRIC RATING
345th/ 347
METRIC RANK
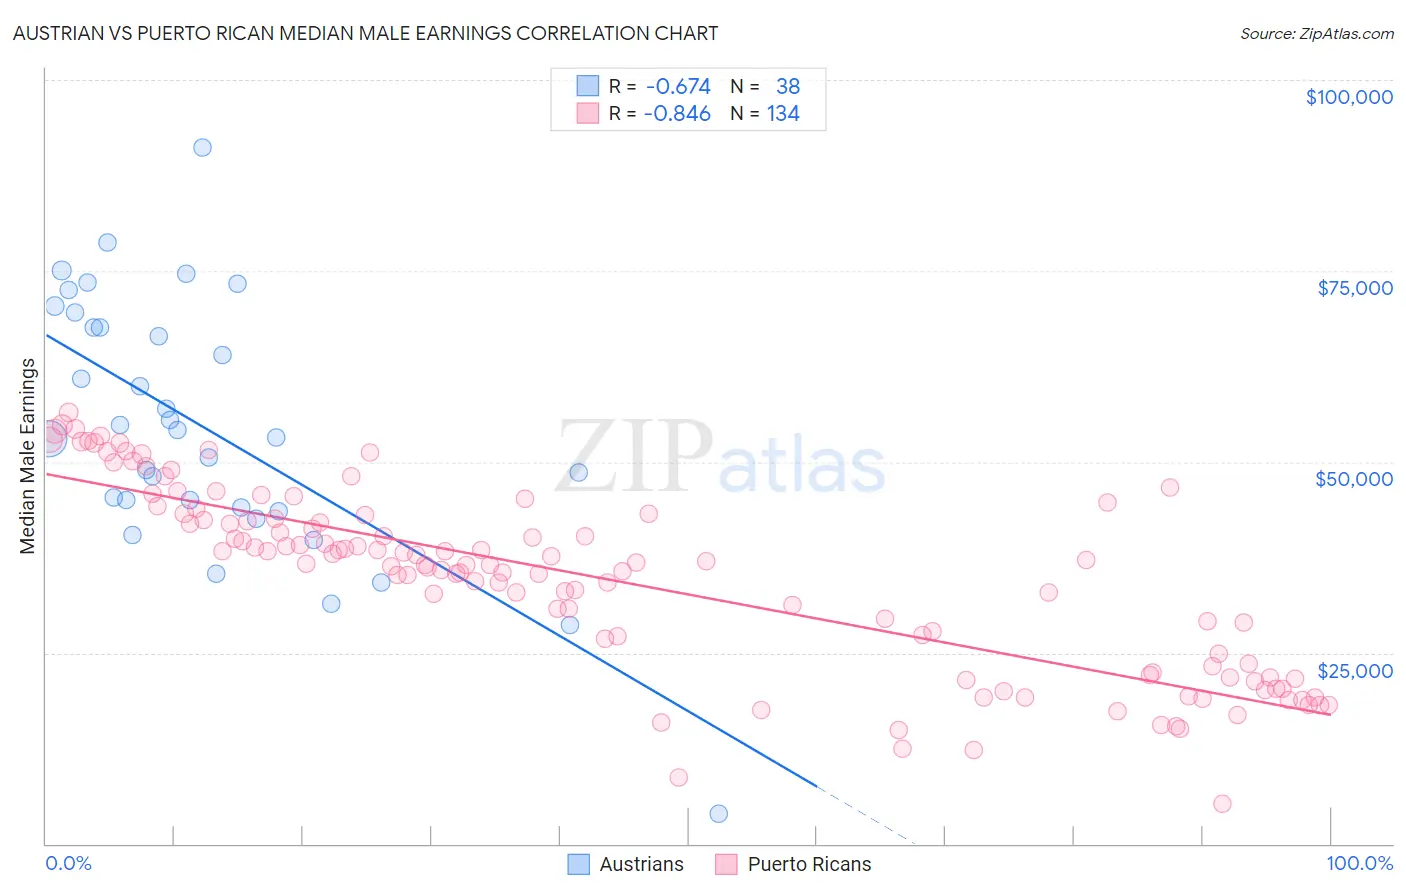
Austrian vs Puerto Rican Median Male Earnings Correlation Chart
The statistical analysis conducted on geographies consisting of 451,854,520 people shows a significant negative correlation between the proportion of Austrians and median male earnings in the United States with a correlation coefficient (R) of -0.674 and weighted average of $59,359. Similarly, the statistical analysis conducted on geographies consisting of 527,834,370 people shows a very strong negative correlation between the proportion of Puerto Ricans and median male earnings in the United States with a correlation coefficient (R) of -0.846 and weighted average of $40,071, a difference of 48.1%.
Median Male Earnings Correlation Summary
| Measurement | Austrian | Puerto Rican |
| Minimum | $3,902 | $5,183 |
| Maximum | $91,143 | $56,414 |
| Range | $87,241 | $51,231 |
| Mean | $54,430 | $34,723 |
| Median | $53,632 | $36,571 |
| Interquartile 25% (IQ1) | $43,967 | $23,294 |
| Interquartile 75% (IQ3) | $67,629 | $43,124 |
| Interquartile Range (IQR) | $23,662 | $19,830 |
| Standard Deviation (Sample) | $16,958 | $11,965 |
| Standard Deviation (Population) | $16,734 | $11,920 |
Similar Demographics by Median Male Earnings
Demographics Similar to Austrians by Median Male Earnings
In terms of median male earnings, the demographic groups most similar to Austrians are Laotian ($59,351, a difference of 0.010%), Immigrants from Moldova ($59,417, a difference of 0.10%), Immigrants from Kazakhstan ($59,278, a difference of 0.14%), Immigrants from Argentina ($59,491, a difference of 0.22%), and Immigrants from Southern Europe ($59,217, a difference of 0.24%).
| Demographics | Rating | Rank | Median Male Earnings |
| Immigrants | Italy | 99.4 /100 | #83 | Exceptional $59,691 |
| Afghans | 99.3 /100 | #84 | Exceptional $59,554 |
| Italians | 99.3 /100 | #85 | Exceptional $59,551 |
| Immigrants | England | 99.3 /100 | #86 | Exceptional $59,527 |
| Macedonians | 99.3 /100 | #87 | Exceptional $59,522 |
| Immigrants | Argentina | 99.3 /100 | #88 | Exceptional $59,491 |
| Immigrants | Moldova | 99.2 /100 | #89 | Exceptional $59,417 |
| Austrians | 99.2 /100 | #90 | Exceptional $59,359 |
| Laotians | 99.2 /100 | #91 | Exceptional $59,351 |
| Immigrants | Kazakhstan | 99.1 /100 | #92 | Exceptional $59,278 |
| Immigrants | Southern Europe | 99.0 /100 | #93 | Exceptional $59,217 |
| Immigrants | North Macedonia | 99.0 /100 | #94 | Exceptional $59,189 |
| Immigrants | Lebanon | 98.6 /100 | #95 | Exceptional $58,835 |
| Albanians | 98.4 /100 | #96 | Exceptional $58,680 |
| Northern Europeans | 98.2 /100 | #97 | Exceptional $58,588 |
Demographics Similar to Puerto Ricans by Median Male Earnings
In terms of median male earnings, the demographic groups most similar to Puerto Ricans are Tohono O'odham ($39,543, a difference of 1.3%), Yup'ik ($39,504, a difference of 1.4%), Pueblo ($41,314, a difference of 3.1%), Lumbee ($41,715, a difference of 4.1%), and Arapaho ($41,758, a difference of 4.2%).
| Demographics | Rating | Rank | Median Male Earnings |
| Immigrants | Congo | 0.0 /100 | #333 | Tragic $44,204 |
| Immigrants | Yemen | 0.0 /100 | #334 | Tragic $44,083 |
| Spanish American Indians | 0.0 /100 | #335 | Tragic $44,010 |
| Immigrants | Cuba | 0.0 /100 | #336 | Tragic $43,461 |
| Menominee | 0.0 /100 | #337 | Tragic $42,581 |
| Crow | 0.0 /100 | #338 | Tragic $42,434 |
| Pima | 0.0 /100 | #339 | Tragic $42,357 |
| Navajo | 0.0 /100 | #340 | Tragic $42,098 |
| Hopi | 0.0 /100 | #341 | Tragic $42,060 |
| Arapaho | 0.0 /100 | #342 | Tragic $41,758 |
| Lumbee | 0.0 /100 | #343 | Tragic $41,715 |
| Pueblo | 0.0 /100 | #344 | Tragic $41,314 |
| Puerto Ricans | 0.0 /100 | #345 | Tragic $40,071 |
| Tohono O'odham | 0.0 /100 | #346 | Tragic $39,543 |
| Yup'ik | 0.0 /100 | #347 | Tragic $39,504 |