Subsaharan African vs Immigrants from West Indies Median Male Earnings
COMPARE
Subsaharan African
Immigrants from West Indies
Median Male Earnings
Median Male Earnings Comparison
Sub-Saharan Africans
Immigrants from West Indies
$50,408
MEDIAN MALE EARNINGS
1.8/ 100
METRIC RATING
247th/ 347
METRIC RANK
$49,271
MEDIAN MALE EARNINGS
0.6/ 100
METRIC RATING
262nd/ 347
METRIC RANK
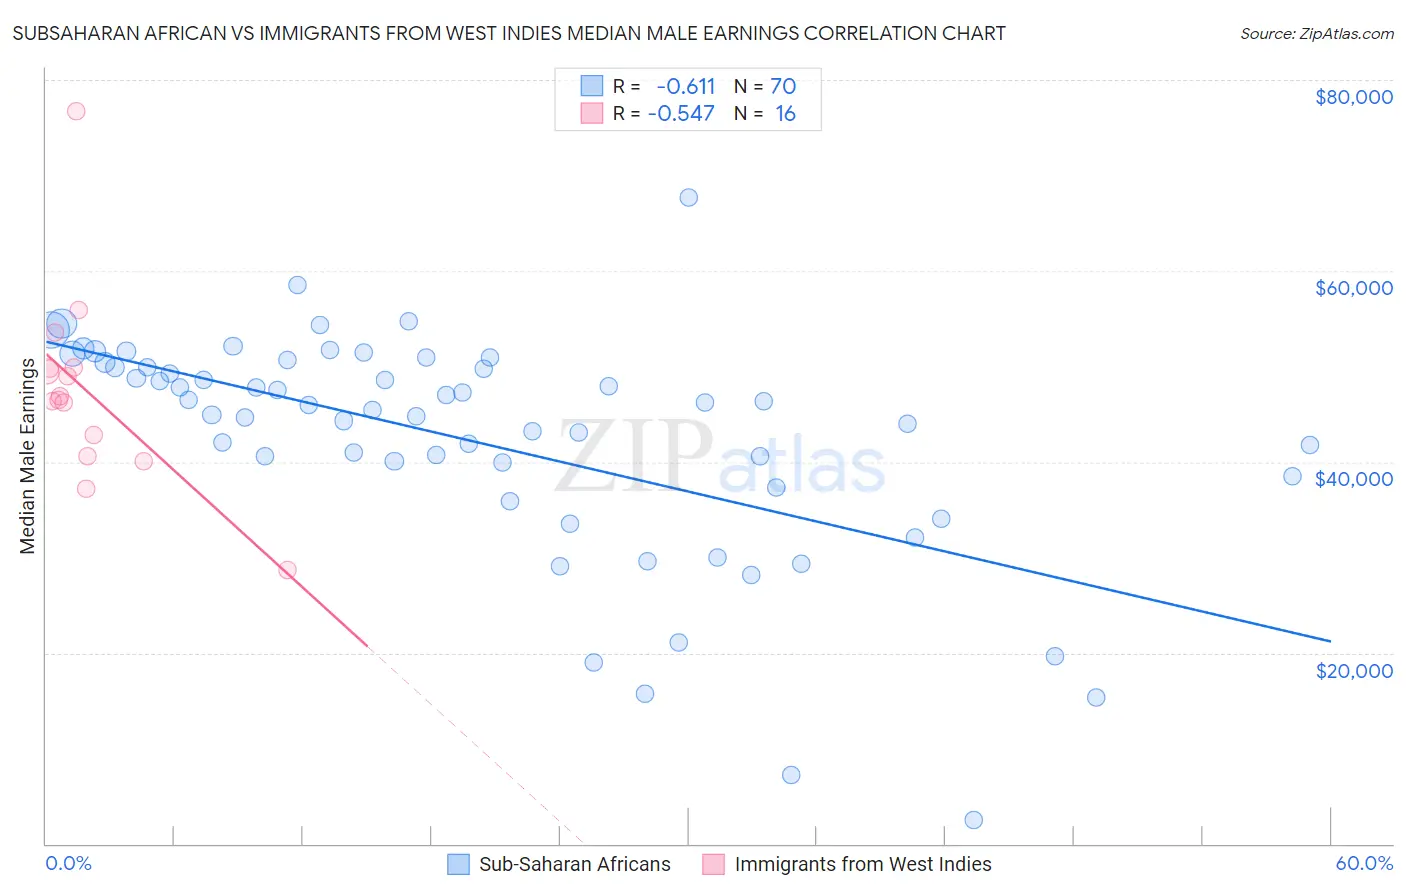
Subsaharan African vs Immigrants from West Indies Median Male Earnings Correlation Chart
The statistical analysis conducted on geographies consisting of 507,818,984 people shows a significant negative correlation between the proportion of Sub-Saharan Africans and median male earnings in the United States with a correlation coefficient (R) of -0.611 and weighted average of $50,408. Similarly, the statistical analysis conducted on geographies consisting of 72,416,935 people shows a substantial negative correlation between the proportion of Immigrants from West Indies and median male earnings in the United States with a correlation coefficient (R) of -0.547 and weighted average of $49,271, a difference of 2.3%.
Median Male Earnings Correlation Summary
| Measurement | Subsaharan African | Immigrants from West Indies |
| Minimum | $2,499 | $28,702 |
| Maximum | $67,727 | $76,711 |
| Range | $65,228 | $48,009 |
| Mean | $42,175 | $47,473 |
| Median | $45,761 | $46,662 |
| Interquartile 25% (IQ1) | $38,471 | $41,722 |
| Interquartile 75% (IQ3) | $49,902 | $49,852 |
| Interquartile Range (IQR) | $11,431 | $8,130 |
| Standard Deviation (Sample) | $12,034 | $10,214 |
| Standard Deviation (Population) | $11,948 | $9,890 |
Demographics Similar to Sub-Saharan Africans and Immigrants from West Indies by Median Male Earnings
In terms of median male earnings, the demographic groups most similar to Sub-Saharan Africans are Immigrants from Ecuador ($50,474, a difference of 0.13%), Hawaiian ($50,488, a difference of 0.16%), Immigrants from Guyana ($50,321, a difference of 0.17%), Immigrants from Burma/Myanmar ($50,298, a difference of 0.22%), and Osage ($50,292, a difference of 0.23%). Similarly, the demographic groups most similar to Immigrants from West Indies are Liberian ($49,318, a difference of 0.10%), Nicaraguan ($49,215, a difference of 0.11%), Immigrants from Middle Africa ($49,201, a difference of 0.14%), Iroquois ($49,374, a difference of 0.21%), and Nepalese ($49,458, a difference of 0.38%).
| Demographics | Rating | Rank | Median Male Earnings |
| Houma | 2.0 /100 | #244 | Tragic $50,547 |
| Hawaiians | 1.9 /100 | #245 | Tragic $50,488 |
| Immigrants | Ecuador | 1.9 /100 | #246 | Tragic $50,474 |
| Sub-Saharan Africans | 1.8 /100 | #247 | Tragic $50,408 |
| Immigrants | Guyana | 1.6 /100 | #248 | Tragic $50,321 |
| Immigrants | Burma/Myanmar | 1.6 /100 | #249 | Tragic $50,298 |
| Osage | 1.6 /100 | #250 | Tragic $50,292 |
| Immigrants | Grenada | 1.6 /100 | #251 | Tragic $50,279 |
| Immigrants | Cabo Verde | 1.2 /100 | #252 | Tragic $50,009 |
| German Russians | 1.1 /100 | #253 | Tragic $49,924 |
| Senegalese | 1.0 /100 | #254 | Tragic $49,774 |
| Alaskan Athabascans | 0.9 /100 | #255 | Tragic $49,748 |
| Alaska Natives | 0.9 /100 | #256 | Tragic $49,711 |
| British West Indians | 0.8 /100 | #257 | Tragic $49,636 |
| Cree | 0.7 /100 | #258 | Tragic $49,497 |
| Nepalese | 0.7 /100 | #259 | Tragic $49,458 |
| Iroquois | 0.7 /100 | #260 | Tragic $49,374 |
| Liberians | 0.6 /100 | #261 | Tragic $49,318 |
| Immigrants | West Indies | 0.6 /100 | #262 | Tragic $49,271 |
| Nicaraguans | 0.6 /100 | #263 | Tragic $49,215 |
| Immigrants | Middle Africa | 0.6 /100 | #264 | Tragic $49,201 |