Austrian vs Immigrants from West Indies Male Poverty
COMPARE
Austrian
Immigrants from West Indies
Male Poverty
Male Poverty Comparison
Austrians
Immigrants from West Indies
10.1%
MALE POVERTY
97.8/ 100
METRIC RATING
61st/ 347
METRIC RANK
13.5%
MALE POVERTY
0.0/ 100
METRIC RATING
274th/ 347
METRIC RANK
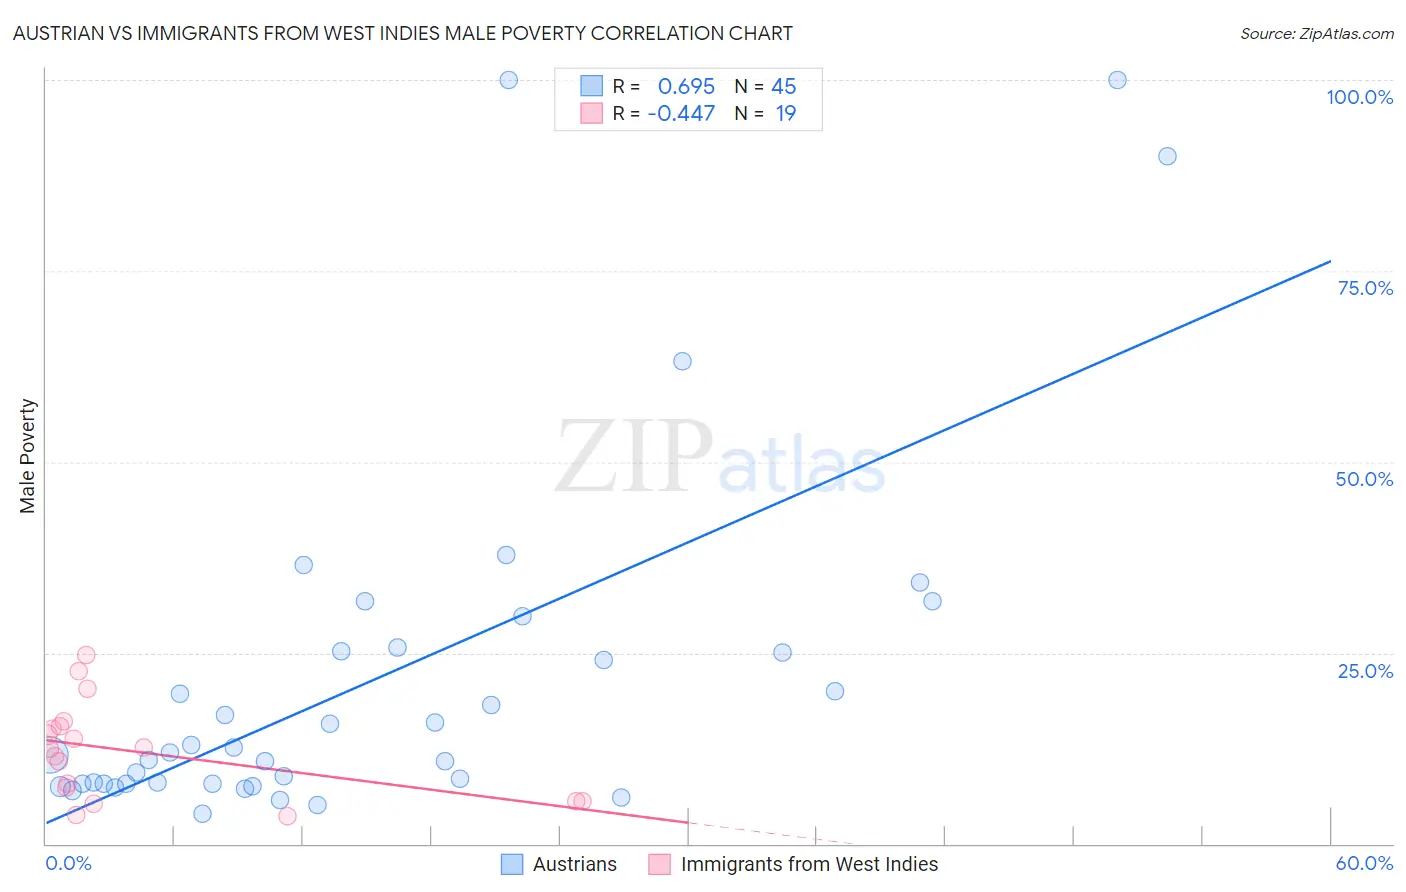
Austrian vs Immigrants from West Indies Male Poverty Correlation Chart
The statistical analysis conducted on geographies consisting of 451,474,043 people shows a significant positive correlation between the proportion of Austrians and poverty level among males in the United States with a correlation coefficient (R) of 0.695 and weighted average of 10.1%. Similarly, the statistical analysis conducted on geographies consisting of 72,454,628 people shows a moderate negative correlation between the proportion of Immigrants from West Indies and poverty level among males in the United States with a correlation coefficient (R) of -0.447 and weighted average of 13.5%, a difference of 33.1%.
Male Poverty Correlation Summary
| Measurement | Austrian | Immigrants from West Indies |
| Minimum | 4.0% | 3.6% |
| Maximum | 100.0% | 24.7% |
| Range | 96.0% | 21.1% |
| Mean | 21.7% | 12.0% |
| Median | 11.9% | 12.5% |
| Interquartile 25% (IQ1) | 7.9% | 5.6% |
| Interquartile 75% (IQ3) | 25.5% | 15.4% |
| Interquartile Range (IQR) | 17.6% | 9.8% |
| Standard Deviation (Sample) | 23.4% | 6.2% |
| Standard Deviation (Population) | 23.2% | 6.0% |
Similar Demographics by Male Poverty
Demographics Similar to Austrians by Male Poverty
In terms of male poverty, the demographic groups most similar to Austrians are Ukrainian (10.1%, a difference of 0.020%), Immigrants from Italy (10.2%, a difference of 0.090%), Immigrants from Europe (10.1%, a difference of 0.11%), Slovak (10.2%, a difference of 0.13%), and Scandinavian (10.1%, a difference of 0.24%).
| Demographics | Rating | Rank | Male Poverty |
| Immigrants | Austria | 98.5 /100 | #54 | Exceptional 10.0% |
| Germans | 98.3 /100 | #55 | Exceptional 10.1% |
| Immigrants | Bulgaria | 98.2 /100 | #56 | Exceptional 10.1% |
| Estonians | 98.1 /100 | #57 | Exceptional 10.1% |
| Scandinavians | 98.0 /100 | #58 | Exceptional 10.1% |
| Immigrants | Europe | 97.9 /100 | #59 | Exceptional 10.1% |
| Ukrainians | 97.9 /100 | #60 | Exceptional 10.1% |
| Austrians | 97.8 /100 | #61 | Exceptional 10.1% |
| Immigrants | Italy | 97.8 /100 | #62 | Exceptional 10.2% |
| Slovaks | 97.7 /100 | #63 | Exceptional 10.2% |
| Swiss | 97.5 /100 | #64 | Exceptional 10.2% |
| Zimbabweans | 97.5 /100 | #65 | Exceptional 10.2% |
| Serbians | 97.5 /100 | #66 | Exceptional 10.2% |
| Immigrants | Netherlands | 97.3 /100 | #67 | Exceptional 10.2% |
| Immigrants | Sri Lanka | 97.2 /100 | #68 | Exceptional 10.2% |
Demographics Similar to Immigrants from West Indies by Male Poverty
In terms of male poverty, the demographic groups most similar to Immigrants from West Indies are Chickasaw (13.5%, a difference of 0.070%), Immigrants from Bahamas (13.5%, a difference of 0.37%), Barbadian (13.6%, a difference of 0.62%), Immigrants from Latin America (13.6%, a difference of 0.82%), and Bangladeshi (13.6%, a difference of 0.97%).
| Demographics | Rating | Rank | Male Poverty |
| Immigrants | Jamaica | 0.1 /100 | #267 | Tragic 13.3% |
| Sub-Saharan Africans | 0.1 /100 | #268 | Tragic 13.3% |
| Guyanese | 0.0 /100 | #269 | Tragic 13.3% |
| Cree | 0.0 /100 | #270 | Tragic 13.3% |
| Spanish Americans | 0.0 /100 | #271 | Tragic 13.4% |
| Immigrants | Bahamas | 0.0 /100 | #272 | Tragic 13.5% |
| Chickasaw | 0.0 /100 | #273 | Tragic 13.5% |
| Immigrants | West Indies | 0.0 /100 | #274 | Tragic 13.5% |
| Barbadians | 0.0 /100 | #275 | Tragic 13.6% |
| Immigrants | Latin America | 0.0 /100 | #276 | Tragic 13.6% |
| Bangladeshis | 0.0 /100 | #277 | Tragic 13.6% |
| Belizeans | 0.0 /100 | #278 | Tragic 13.6% |
| Haitians | 0.0 /100 | #279 | Tragic 13.7% |
| Mexicans | 0.0 /100 | #280 | Tragic 13.7% |
| Yaqui | 0.0 /100 | #281 | Tragic 13.7% |