Austrian vs Immigrants from West Indies Disability Age 18 to 34
COMPARE
Austrian
Immigrants from West Indies
Disability Age 18 to 34
Disability Age 18 to 34 Comparison
Austrians
Immigrants from West Indies
7.1%
DISABILITY AGE 18 TO 34
1.3/ 100
METRIC RATING
237th/ 347
METRIC RANK
6.0%
DISABILITY AGE 18 TO 34
99.4/ 100
METRIC RATING
69th/ 347
METRIC RANK
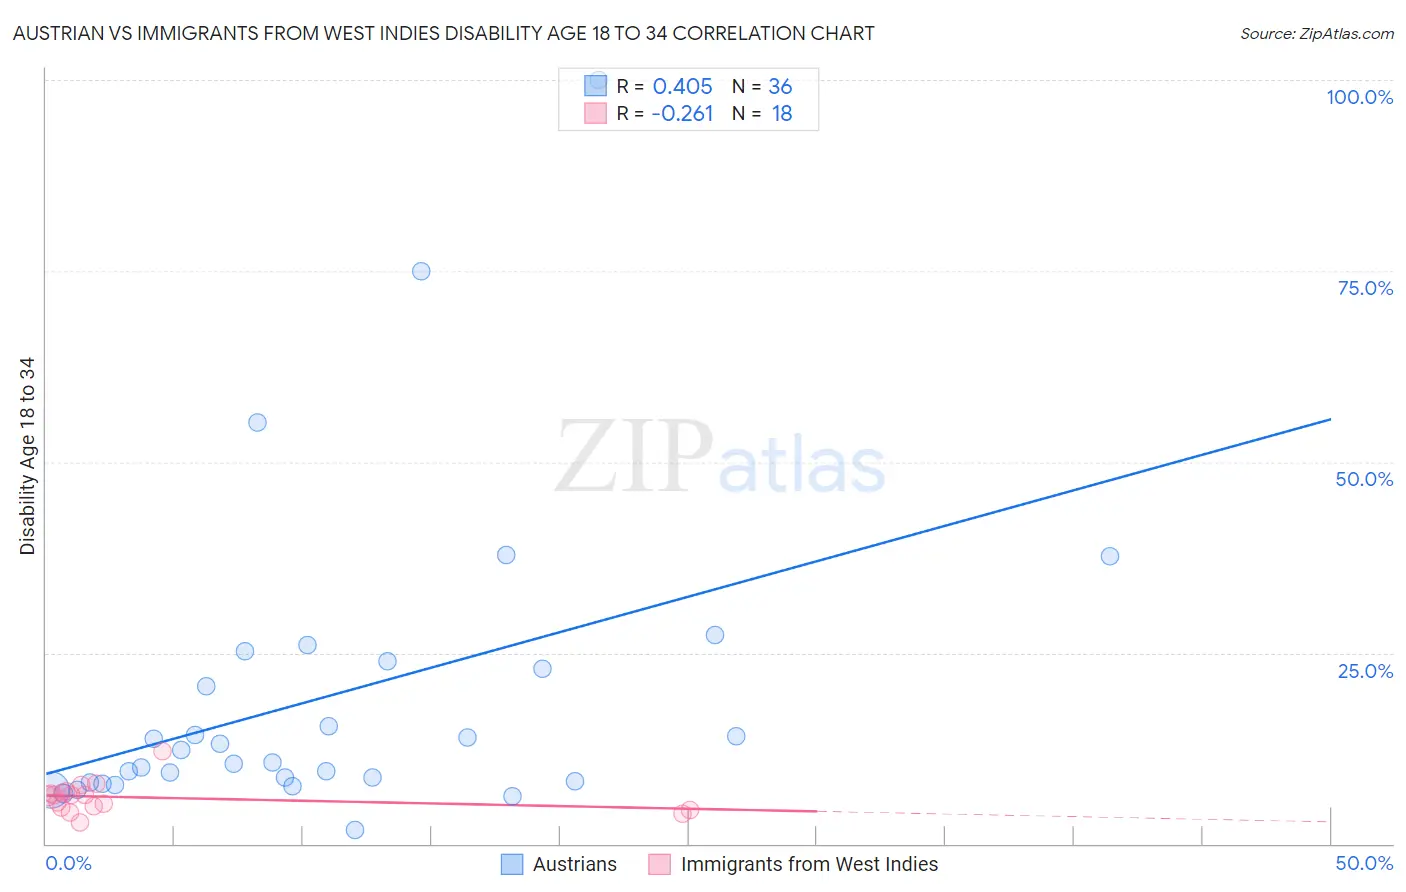
Austrian vs Immigrants from West Indies Disability Age 18 to 34 Correlation Chart
The statistical analysis conducted on geographies consisting of 450,218,227 people shows a moderate positive correlation between the proportion of Austrians and percentage of population with a disability between the ages 18 and 35 in the United States with a correlation coefficient (R) of 0.405 and weighted average of 7.1%. Similarly, the statistical analysis conducted on geographies consisting of 72,437,406 people shows a weak negative correlation between the proportion of Immigrants from West Indies and percentage of population with a disability between the ages 18 and 35 in the United States with a correlation coefficient (R) of -0.261 and weighted average of 6.0%, a difference of 17.9%.
Disability Age 18 to 34 Correlation Summary
| Measurement | Austrian | Immigrants from West Indies |
| Minimum | 1.7% | 2.7% |
| Maximum | 100.0% | 12.1% |
| Range | 98.3% | 9.4% |
| Mean | 19.3% | 6.0% |
| Median | 11.5% | 6.3% |
| Interquartile 25% (IQ1) | 8.1% | 4.7% |
| Interquartile 75% (IQ3) | 23.4% | 6.7% |
| Interquartile Range (IQR) | 15.4% | 2.0% |
| Standard Deviation (Sample) | 20.2% | 2.0% |
| Standard Deviation (Population) | 20.0% | 2.0% |
Similar Demographics by Disability Age 18 to 34
Demographics Similar to Austrians by Disability Age 18 to 34
In terms of disability age 18 to 34, the demographic groups most similar to Austrians are Marshallese (7.1%, a difference of 0.050%), Italian (7.1%, a difference of 0.16%), Liberian (7.1%, a difference of 0.17%), Arapaho (7.1%, a difference of 0.28%), and Nepalese (7.1%, a difference of 0.28%).
| Demographics | Rating | Rank | Disability Age 18 to 34 |
| Immigrants | North America | 3.9 /100 | #230 | Tragic 7.0% |
| Ute | 3.8 /100 | #231 | Tragic 7.0% |
| Samoans | 3.2 /100 | #232 | Tragic 7.0% |
| New Zealanders | 2.7 /100 | #233 | Tragic 7.0% |
| Alsatians | 2.1 /100 | #234 | Tragic 7.0% |
| Sub-Saharan Africans | 1.7 /100 | #235 | Tragic 7.1% |
| Liberians | 1.5 /100 | #236 | Tragic 7.1% |
| Austrians | 1.3 /100 | #237 | Tragic 7.1% |
| Marshallese | 1.3 /100 | #238 | Tragic 7.1% |
| Italians | 1.2 /100 | #239 | Tragic 7.1% |
| Arapaho | 1.1 /100 | #240 | Tragic 7.1% |
| Nepalese | 1.1 /100 | #241 | Tragic 7.1% |
| Immigrants | Congo | 1.1 /100 | #242 | Tragic 7.1% |
| Icelanders | 1.0 /100 | #243 | Tragic 7.1% |
| Immigrants | Zaire | 0.9 /100 | #244 | Tragic 7.1% |
Demographics Similar to Immigrants from West Indies by Disability Age 18 to 34
In terms of disability age 18 to 34, the demographic groups most similar to Immigrants from West Indies are Immigrants from Greece (6.0%, a difference of 0.060%), Immigrants from Poland (6.0%, a difference of 0.25%), Immigrants from North Macedonia (6.0%, a difference of 0.31%), Immigrants from Japan (6.0%, a difference of 0.33%), and Burmese (6.0%, a difference of 0.35%).
| Demographics | Rating | Rank | Disability Age 18 to 34 |
| Peruvians | 99.6 /100 | #62 | Exceptional 6.0% |
| Salvadorans | 99.6 /100 | #63 | Exceptional 6.0% |
| Taiwanese | 99.6 /100 | #64 | Exceptional 6.0% |
| Trinidadians and Tobagonians | 99.5 /100 | #65 | Exceptional 6.0% |
| Burmese | 99.5 /100 | #66 | Exceptional 6.0% |
| Immigrants | North Macedonia | 99.5 /100 | #67 | Exceptional 6.0% |
| Immigrants | Poland | 99.5 /100 | #68 | Exceptional 6.0% |
| Immigrants | West Indies | 99.4 /100 | #69 | Exceptional 6.0% |
| Immigrants | Greece | 99.4 /100 | #70 | Exceptional 6.0% |
| Immigrants | Japan | 99.3 /100 | #71 | Exceptional 6.0% |
| Immigrants | Lebanon | 99.2 /100 | #72 | Exceptional 6.0% |
| Cypriots | 99.2 /100 | #73 | Exceptional 6.0% |
| Haitians | 99.2 /100 | #74 | Exceptional 6.0% |
| Immigrants | Turkey | 99.1 /100 | #75 | Exceptional 6.1% |
| Immigrants | Western Asia | 98.9 /100 | #76 | Exceptional 6.1% |