Blackfeet vs Immigrants from West Indies Median Male Earnings
COMPARE
Blackfeet
Immigrants from West Indies
Median Male Earnings
Median Male Earnings Comparison
Blackfeet
Immigrants from West Indies
$48,402
MEDIAN MALE EARNINGS
0.3/ 100
METRIC RATING
276th/ 347
METRIC RANK
$49,271
MEDIAN MALE EARNINGS
0.6/ 100
METRIC RATING
262nd/ 347
METRIC RANK
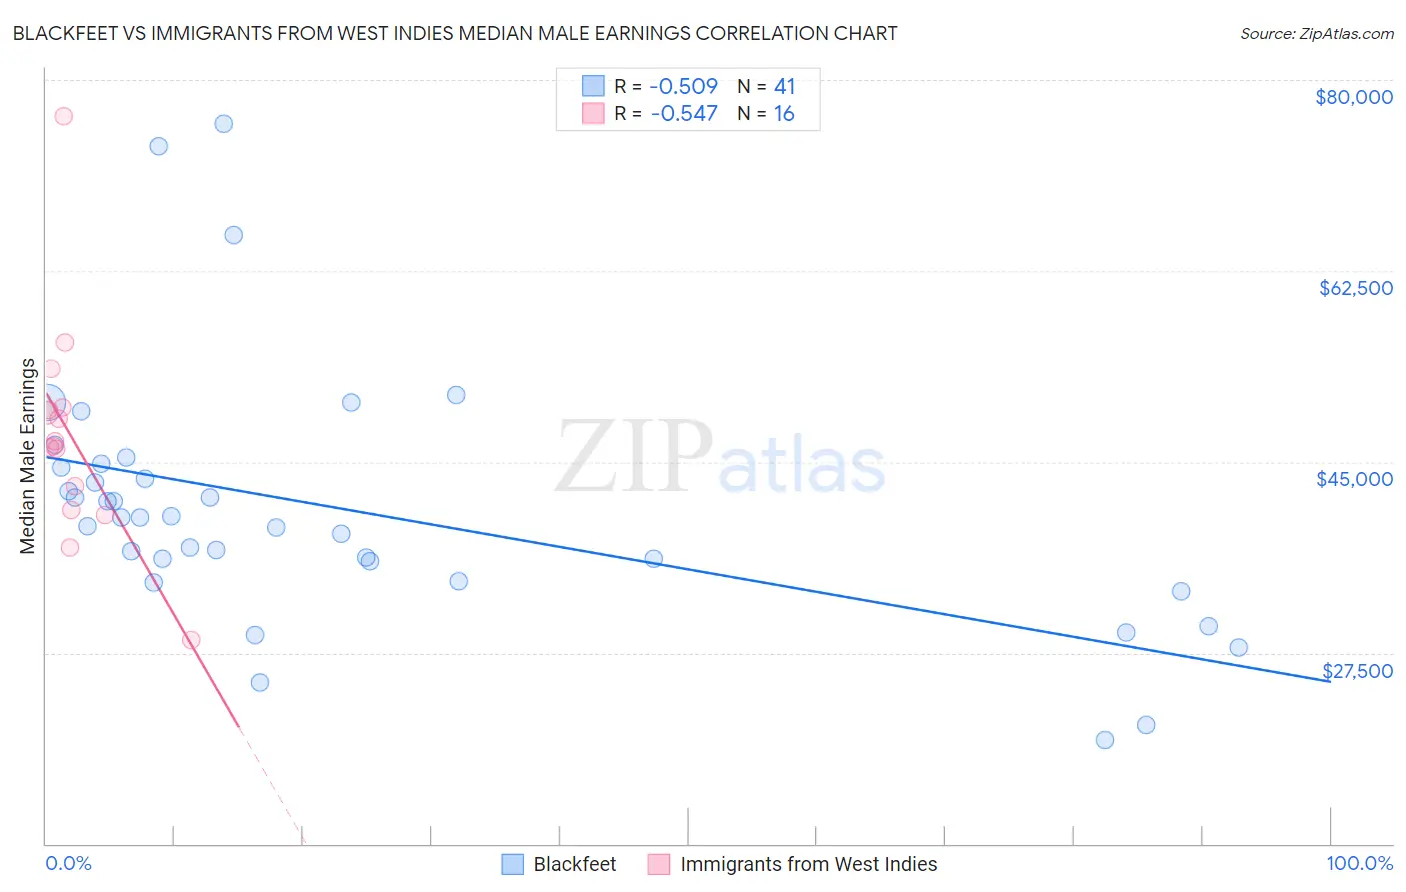
Blackfeet vs Immigrants from West Indies Median Male Earnings Correlation Chart
The statistical analysis conducted on geographies consisting of 309,464,268 people shows a substantial negative correlation between the proportion of Blackfeet and median male earnings in the United States with a correlation coefficient (R) of -0.509 and weighted average of $48,402. Similarly, the statistical analysis conducted on geographies consisting of 72,416,935 people shows a substantial negative correlation between the proportion of Immigrants from West Indies and median male earnings in the United States with a correlation coefficient (R) of -0.547 and weighted average of $49,271, a difference of 1.8%.
Median Male Earnings Correlation Summary
| Measurement | Blackfeet | Immigrants from West Indies |
| Minimum | $19,559 | $28,702 |
| Maximum | $76,032 | $76,711 |
| Range | $56,473 | $48,009 |
| Mean | $40,687 | $47,473 |
| Median | $39,915 | $46,662 |
| Interquartile 25% (IQ1) | $35,022 | $41,722 |
| Interquartile 75% (IQ3) | $44,674 | $49,852 |
| Interquartile Range (IQR) | $9,652 | $8,130 |
| Standard Deviation (Sample) | $11,608 | $10,214 |
| Standard Deviation (Population) | $11,465 | $9,890 |
Demographics Similar to Blackfeet and Immigrants from West Indies by Median Male Earnings
In terms of median male earnings, the demographic groups most similar to Blackfeet are Immigrants from Somalia ($48,439, a difference of 0.080%), Belizean ($48,358, a difference of 0.090%), Immigrants from Liberia ($48,317, a difference of 0.18%), Colville ($48,516, a difference of 0.24%), and Hmong ($48,254, a difference of 0.31%). Similarly, the demographic groups most similar to Immigrants from West Indies are Liberian ($49,318, a difference of 0.10%), Nicaraguan ($49,215, a difference of 0.11%), Immigrants from Middle Africa ($49,201, a difference of 0.14%), Immigrants from Laos ($49,190, a difference of 0.16%), and Iroquois ($49,374, a difference of 0.21%).
| Demographics | Rating | Rank | Median Male Earnings |
| Nepalese | 0.7 /100 | #259 | Tragic $49,458 |
| Iroquois | 0.7 /100 | #260 | Tragic $49,374 |
| Liberians | 0.6 /100 | #261 | Tragic $49,318 |
| Immigrants | West Indies | 0.6 /100 | #262 | Tragic $49,271 |
| Nicaraguans | 0.6 /100 | #263 | Tragic $49,215 |
| Immigrants | Middle Africa | 0.6 /100 | #264 | Tragic $49,201 |
| Immigrants | Laos | 0.6 /100 | #265 | Tragic $49,190 |
| Somalis | 0.5 /100 | #266 | Tragic $49,025 |
| Spanish Americans | 0.5 /100 | #267 | Tragic $49,008 |
| Ute | 0.4 /100 | #268 | Tragic $48,899 |
| Tsimshian | 0.4 /100 | #269 | Tragic $48,836 |
| Potawatomi | 0.4 /100 | #270 | Tragic $48,768 |
| Cherokee | 0.3 /100 | #271 | Tragic $48,669 |
| Salvadorans | 0.3 /100 | #272 | Tragic $48,646 |
| Jamaicans | 0.3 /100 | #273 | Tragic $48,632 |
| Colville | 0.3 /100 | #274 | Tragic $48,516 |
| Immigrants | Somalia | 0.3 /100 | #275 | Tragic $48,439 |
| Blackfeet | 0.3 /100 | #276 | Tragic $48,402 |
| Belizeans | 0.2 /100 | #277 | Tragic $48,358 |
| Immigrants | Liberia | 0.2 /100 | #278 | Tragic $48,317 |
| Hmong | 0.2 /100 | #279 | Tragic $48,254 |