Austrian vs Immigrants from Northern Africa Median Male Earnings
COMPARE
Austrian
Immigrants from Northern Africa
Median Male Earnings
Median Male Earnings Comparison
Austrians
Immigrants from Northern Africa
$59,359
MEDIAN MALE EARNINGS
99.2/ 100
METRIC RATING
90th/ 347
METRIC RANK
$58,008
MEDIAN MALE EARNINGS
96.9/ 100
METRIC RATING
106th/ 347
METRIC RANK
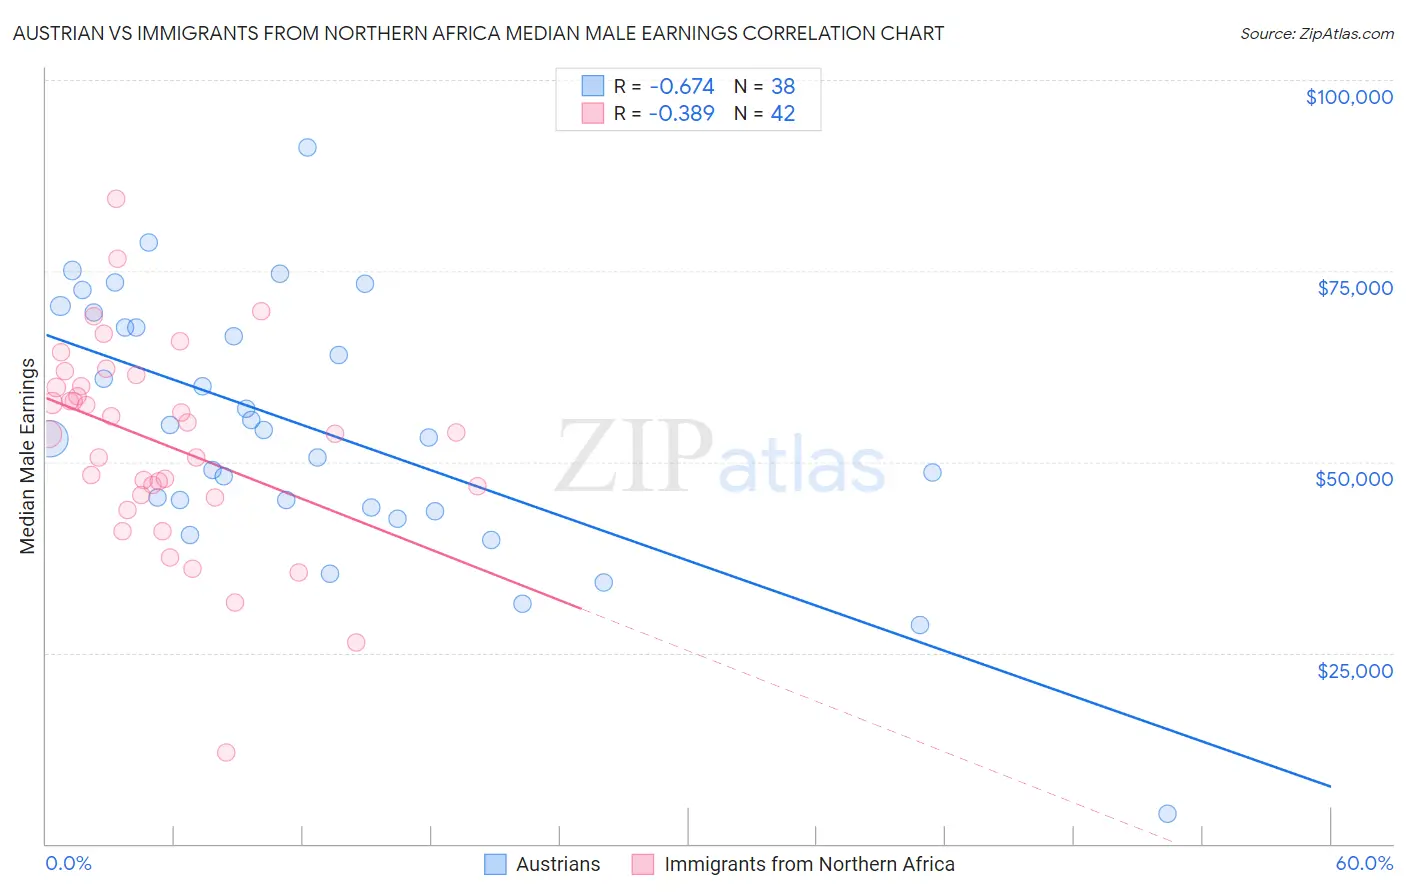
Austrian vs Immigrants from Northern Africa Median Male Earnings Correlation Chart
The statistical analysis conducted on geographies consisting of 451,854,520 people shows a significant negative correlation between the proportion of Austrians and median male earnings in the United States with a correlation coefficient (R) of -0.674 and weighted average of $59,359. Similarly, the statistical analysis conducted on geographies consisting of 321,143,367 people shows a mild negative correlation between the proportion of Immigrants from Northern Africa and median male earnings in the United States with a correlation coefficient (R) of -0.389 and weighted average of $58,008, a difference of 2.3%.
Median Male Earnings Correlation Summary
| Measurement | Austrian | Immigrants from Northern Africa |
| Minimum | $3,902 | $12,000 |
| Maximum | $91,143 | $84,392 |
| Range | $87,241 | $72,392 |
| Mean | $54,430 | $52,417 |
| Median | $53,632 | $53,736 |
| Interquartile 25% (IQ1) | $43,967 | $45,608 |
| Interquartile 75% (IQ3) | $67,629 | $59,910 |
| Interquartile Range (IQR) | $23,662 | $14,302 |
| Standard Deviation (Sample) | $16,958 | $13,421 |
| Standard Deviation (Population) | $16,734 | $13,260 |
Demographics Similar to Austrians and Immigrants from Northern Africa by Median Male Earnings
In terms of median male earnings, the demographic groups most similar to Austrians are Laotian ($59,351, a difference of 0.010%), Immigrants from Moldova ($59,417, a difference of 0.10%), Immigrants from Kazakhstan ($59,278, a difference of 0.14%), Immigrants from Argentina ($59,491, a difference of 0.22%), and Immigrants from Southern Europe ($59,217, a difference of 0.24%). Similarly, the demographic groups most similar to Immigrants from Northern Africa are Serbian ($57,975, a difference of 0.060%), Immigrants from Uzbekistan ($57,941, a difference of 0.12%), Immigrants from Western Asia ($58,131, a difference of 0.21%), Armenian ($58,134, a difference of 0.22%), and Polish ($58,139, a difference of 0.23%).
| Demographics | Rating | Rank | Median Male Earnings |
| Immigrants | Argentina | 99.3 /100 | #88 | Exceptional $59,491 |
| Immigrants | Moldova | 99.2 /100 | #89 | Exceptional $59,417 |
| Austrians | 99.2 /100 | #90 | Exceptional $59,359 |
| Laotians | 99.2 /100 | #91 | Exceptional $59,351 |
| Immigrants | Kazakhstan | 99.1 /100 | #92 | Exceptional $59,278 |
| Immigrants | Southern Europe | 99.0 /100 | #93 | Exceptional $59,217 |
| Immigrants | North Macedonia | 99.0 /100 | #94 | Exceptional $59,189 |
| Immigrants | Lebanon | 98.6 /100 | #95 | Exceptional $58,835 |
| Albanians | 98.4 /100 | #96 | Exceptional $58,680 |
| Northern Europeans | 98.2 /100 | #97 | Exceptional $58,588 |
| Jordanians | 98.1 /100 | #98 | Exceptional $58,500 |
| Immigrants | Poland | 98.0 /100 | #99 | Exceptional $58,452 |
| Assyrians/Chaldeans/Syriacs | 97.9 /100 | #100 | Exceptional $58,437 |
| Immigrants | Brazil | 97.7 /100 | #101 | Exceptional $58,324 |
| Syrians | 97.4 /100 | #102 | Exceptional $58,187 |
| Poles | 97.3 /100 | #103 | Exceptional $58,139 |
| Armenians | 97.3 /100 | #104 | Exceptional $58,134 |
| Immigrants | Western Asia | 97.3 /100 | #105 | Exceptional $58,131 |
| Immigrants | Northern Africa | 96.9 /100 | #106 | Exceptional $58,008 |
| Serbians | 96.8 /100 | #107 | Exceptional $57,975 |
| Immigrants | Uzbekistan | 96.7 /100 | #108 | Exceptional $57,941 |