Austrian vs Immigrants from West Indies Female Disability
COMPARE
Austrian
Immigrants from West Indies
Female Disability
Female Disability Comparison
Austrians
Immigrants from West Indies
12.3%
FEMALE DISABILITY
33.3/ 100
METRIC RATING
186th/ 347
METRIC RANK
12.6%
FEMALE DISABILITY
4.4/ 100
METRIC RATING
236th/ 347
METRIC RANK
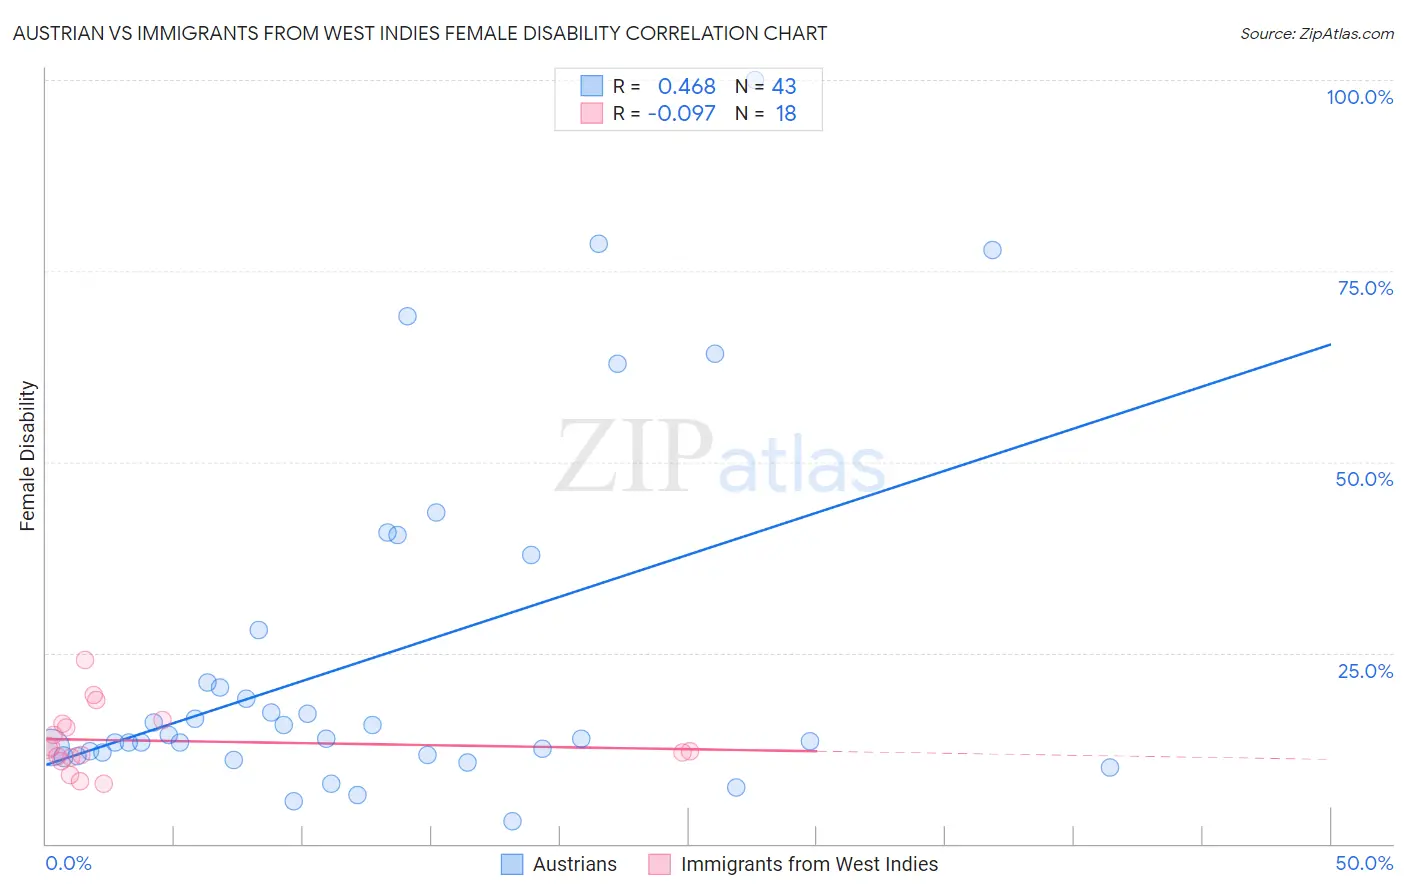
Austrian vs Immigrants from West Indies Female Disability Correlation Chart
The statistical analysis conducted on geographies consisting of 452,021,932 people shows a moderate positive correlation between the proportion of Austrians and percentage of females with a disability in the United States with a correlation coefficient (R) of 0.468 and weighted average of 12.3%. Similarly, the statistical analysis conducted on geographies consisting of 72,456,124 people shows a slight negative correlation between the proportion of Immigrants from West Indies and percentage of females with a disability in the United States with a correlation coefficient (R) of -0.097 and weighted average of 12.6%, a difference of 2.2%.
Female Disability Correlation Summary
| Measurement | Austrian | Immigrants from West Indies |
| Minimum | 2.9% | 7.8% |
| Maximum | 100.0% | 24.1% |
| Range | 97.1% | 16.3% |
| Mean | 24.5% | 13.5% |
| Median | 13.7% | 12.3% |
| Interquartile 25% (IQ1) | 11.6% | 11.3% |
| Interquartile 75% (IQ3) | 28.0% | 15.7% |
| Interquartile Range (IQR) | 16.3% | 4.4% |
| Standard Deviation (Sample) | 23.1% | 4.2% |
| Standard Deviation (Population) | 22.8% | 4.1% |
Similar Demographics by Female Disability
Demographics Similar to Austrians by Female Disability
In terms of female disability, the demographic groups most similar to Austrians are Serbian (12.3%, a difference of 0.010%), Immigrants from Uzbekistan (12.3%, a difference of 0.020%), Immigrants from North America (12.3%, a difference of 0.020%), Immigrants from Albania (12.3%, a difference of 0.080%), and Immigrants from Honduras (12.3%, a difference of 0.090%).
| Demographics | Rating | Rank | Female Disability |
| Immigrants | Fiji | 38.2 /100 | #179 | Fair 12.3% |
| Albanians | 37.9 /100 | #180 | Fair 12.3% |
| Immigrants | Canada | 37.2 /100 | #181 | Fair 12.3% |
| Norwegians | 36.9 /100 | #182 | Fair 12.3% |
| Cubans | 36.5 /100 | #183 | Fair 12.3% |
| Iraqis | 36.0 /100 | #184 | Fair 12.3% |
| Immigrants | Uzbekistan | 33.9 /100 | #185 | Fair 12.3% |
| Austrians | 33.3 /100 | #186 | Fair 12.3% |
| Serbians | 33.1 /100 | #187 | Fair 12.3% |
| Immigrants | North America | 32.8 /100 | #188 | Fair 12.3% |
| Immigrants | Albania | 31.6 /100 | #189 | Fair 12.3% |
| Immigrants | Honduras | 31.3 /100 | #190 | Fair 12.3% |
| Armenians | 29.7 /100 | #191 | Fair 12.3% |
| Immigrants | Western Africa | 29.2 /100 | #192 | Fair 12.3% |
| Northern Europeans | 27.5 /100 | #193 | Fair 12.3% |
Demographics Similar to Immigrants from West Indies by Female Disability
In terms of female disability, the demographic groups most similar to Immigrants from West Indies are Malaysian (12.5%, a difference of 0.13%), Slavic (12.6%, a difference of 0.13%), Yugoslavian (12.6%, a difference of 0.15%), Scandinavian (12.5%, a difference of 0.18%), and Immigrants from Iraq (12.5%, a difference of 0.19%).
| Demographics | Rating | Rank | Female Disability |
| Hungarians | 7.2 /100 | #229 | Tragic 12.5% |
| Immigrants | Belize | 7.0 /100 | #230 | Tragic 12.5% |
| Belgians | 6.5 /100 | #231 | Tragic 12.5% |
| Immigrants | Somalia | 5.9 /100 | #232 | Tragic 12.5% |
| Immigrants | Iraq | 5.3 /100 | #233 | Tragic 12.5% |
| Scandinavians | 5.3 /100 | #234 | Tragic 12.5% |
| Malaysians | 5.0 /100 | #235 | Tragic 12.5% |
| Immigrants | West Indies | 4.4 /100 | #236 | Tragic 12.6% |
| Slavs | 3.8 /100 | #237 | Tragic 12.6% |
| Yugoslavians | 3.7 /100 | #238 | Tragic 12.6% |
| Barbadians | 3.6 /100 | #239 | Tragic 12.6% |
| German Russians | 3.2 /100 | #240 | Tragic 12.6% |
| Japanese | 2.7 /100 | #241 | Tragic 12.6% |
| Canadians | 2.6 /100 | #242 | Tragic 12.6% |
| Immigrants | Senegal | 2.5 /100 | #243 | Tragic 12.6% |