Austrian vs Immigrants from Netherlands Median Male Earnings
COMPARE
Austrian
Immigrants from Netherlands
Median Male Earnings
Median Male Earnings Comparison
Austrians
Immigrants from Netherlands
$59,359
MEDIAN MALE EARNINGS
99.2/ 100
METRIC RATING
90th/ 347
METRIC RANK
$61,096
MEDIAN MALE EARNINGS
99.8/ 100
METRIC RATING
59th/ 347
METRIC RANK
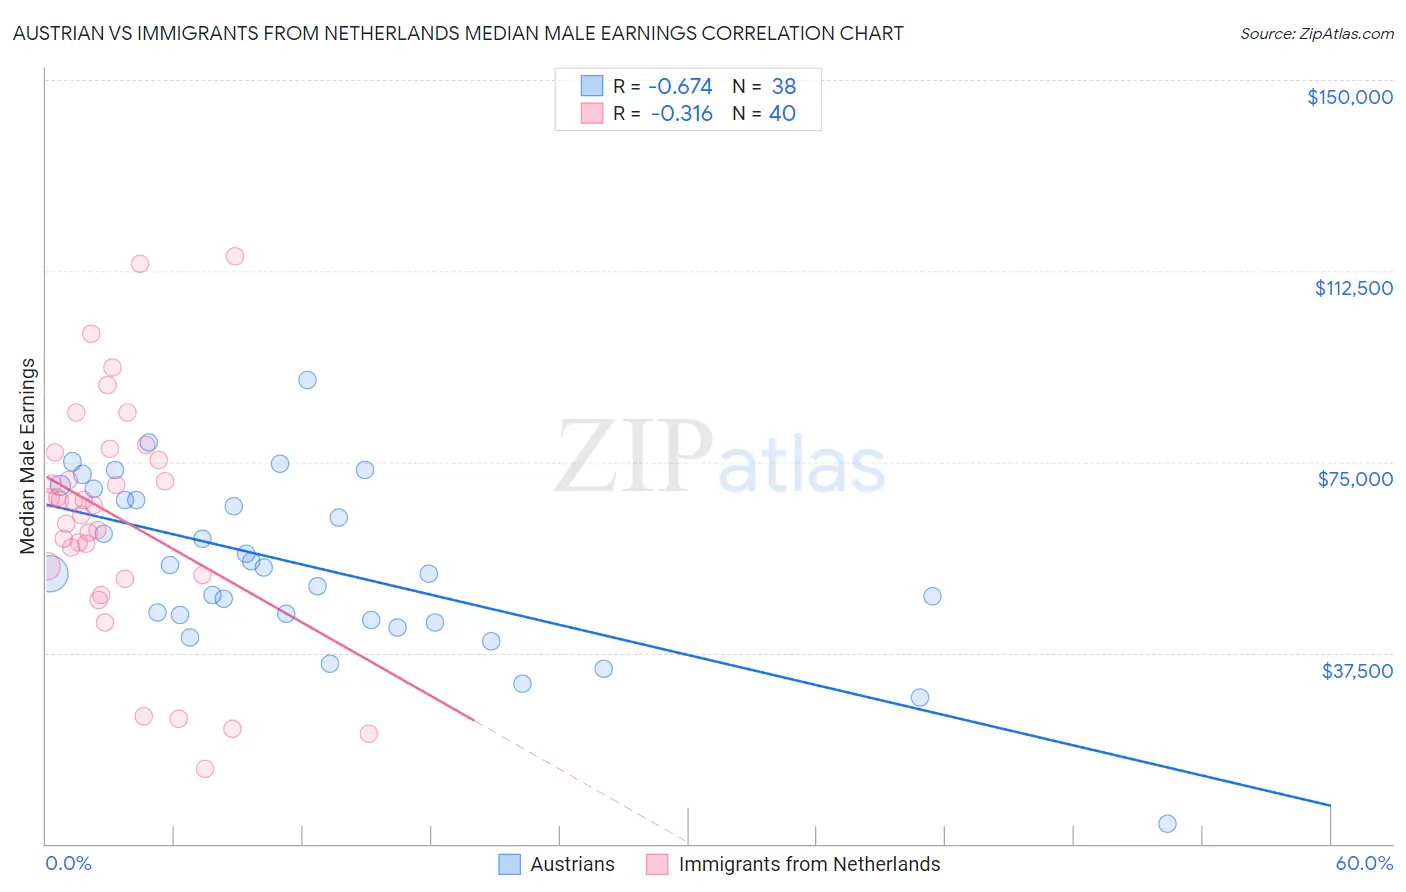
Austrian vs Immigrants from Netherlands Median Male Earnings Correlation Chart
The statistical analysis conducted on geographies consisting of 451,854,520 people shows a significant negative correlation between the proportion of Austrians and median male earnings in the United States with a correlation coefficient (R) of -0.674 and weighted average of $59,359. Similarly, the statistical analysis conducted on geographies consisting of 237,827,633 people shows a mild negative correlation between the proportion of Immigrants from Netherlands and median male earnings in the United States with a correlation coefficient (R) of -0.316 and weighted average of $61,096, a difference of 2.9%.
Median Male Earnings Correlation Summary
| Measurement | Austrian | Immigrants from Netherlands |
| Minimum | $3,902 | $14,643 |
| Maximum | $91,143 | $115,494 |
| Range | $87,241 | $100,851 |
| Mean | $54,430 | $64,341 |
| Median | $53,632 | $66,907 |
| Interquartile 25% (IQ1) | $43,967 | $53,639 |
| Interquartile 75% (IQ3) | $67,629 | $76,092 |
| Interquartile Range (IQR) | $23,662 | $22,453 |
| Standard Deviation (Sample) | $16,958 | $22,767 |
| Standard Deviation (Population) | $16,734 | $22,481 |
Similar Demographics by Median Male Earnings
Demographics Similar to Austrians by Median Male Earnings
In terms of median male earnings, the demographic groups most similar to Austrians are Laotian ($59,351, a difference of 0.010%), Immigrants from Moldova ($59,417, a difference of 0.10%), Immigrants from Kazakhstan ($59,278, a difference of 0.14%), Immigrants from Argentina ($59,491, a difference of 0.22%), and Immigrants from Southern Europe ($59,217, a difference of 0.24%).
| Demographics | Rating | Rank | Median Male Earnings |
| Immigrants | Italy | 99.4 /100 | #83 | Exceptional $59,691 |
| Afghans | 99.3 /100 | #84 | Exceptional $59,554 |
| Italians | 99.3 /100 | #85 | Exceptional $59,551 |
| Immigrants | England | 99.3 /100 | #86 | Exceptional $59,527 |
| Macedonians | 99.3 /100 | #87 | Exceptional $59,522 |
| Immigrants | Argentina | 99.3 /100 | #88 | Exceptional $59,491 |
| Immigrants | Moldova | 99.2 /100 | #89 | Exceptional $59,417 |
| Austrians | 99.2 /100 | #90 | Exceptional $59,359 |
| Laotians | 99.2 /100 | #91 | Exceptional $59,351 |
| Immigrants | Kazakhstan | 99.1 /100 | #92 | Exceptional $59,278 |
| Immigrants | Southern Europe | 99.0 /100 | #93 | Exceptional $59,217 |
| Immigrants | North Macedonia | 99.0 /100 | #94 | Exceptional $59,189 |
| Immigrants | Lebanon | 98.6 /100 | #95 | Exceptional $58,835 |
| Albanians | 98.4 /100 | #96 | Exceptional $58,680 |
| Northern Europeans | 98.2 /100 | #97 | Exceptional $58,588 |
Demographics Similar to Immigrants from Netherlands by Median Male Earnings
In terms of median male earnings, the demographic groups most similar to Immigrants from Netherlands are Egyptian ($61,095, a difference of 0.0%), Bolivian ($61,066, a difference of 0.050%), Immigrants from Romania ($61,040, a difference of 0.090%), New Zealander ($61,199, a difference of 0.17%), and Immigrants from Pakistan ($60,987, a difference of 0.18%).
| Demographics | Rating | Rank | Median Male Earnings |
| Immigrants | Norway | 99.9 /100 | #52 | Exceptional $61,628 |
| South Africans | 99.9 /100 | #53 | Exceptional $61,460 |
| Immigrants | Latvia | 99.9 /100 | #54 | Exceptional $61,422 |
| Greeks | 99.9 /100 | #55 | Exceptional $61,242 |
| Lithuanians | 99.9 /100 | #56 | Exceptional $61,228 |
| Immigrants | Scotland | 99.9 /100 | #57 | Exceptional $61,220 |
| New Zealanders | 99.9 /100 | #58 | Exceptional $61,199 |
| Immigrants | Netherlands | 99.8 /100 | #59 | Exceptional $61,096 |
| Egyptians | 99.8 /100 | #60 | Exceptional $61,095 |
| Bolivians | 99.8 /100 | #61 | Exceptional $61,066 |
| Immigrants | Romania | 99.8 /100 | #62 | Exceptional $61,040 |
| Immigrants | Pakistan | 99.8 /100 | #63 | Exceptional $60,987 |
| Immigrants | Eastern Europe | 99.8 /100 | #64 | Exceptional $60,958 |
| Immigrants | Indonesia | 99.8 /100 | #65 | Exceptional $60,935 |
| Immigrants | Croatia | 99.8 /100 | #66 | Exceptional $60,914 |