Kiowa vs Immigrants from West Indies Median Male Earnings
COMPARE
Kiowa
Immigrants from West Indies
Median Male Earnings
Median Male Earnings Comparison
Kiowa
Immigrants from West Indies
$45,094
MEDIAN MALE EARNINGS
0.0/ 100
METRIC RATING
328th/ 347
METRIC RANK
$49,271
MEDIAN MALE EARNINGS
0.6/ 100
METRIC RATING
262nd/ 347
METRIC RANK
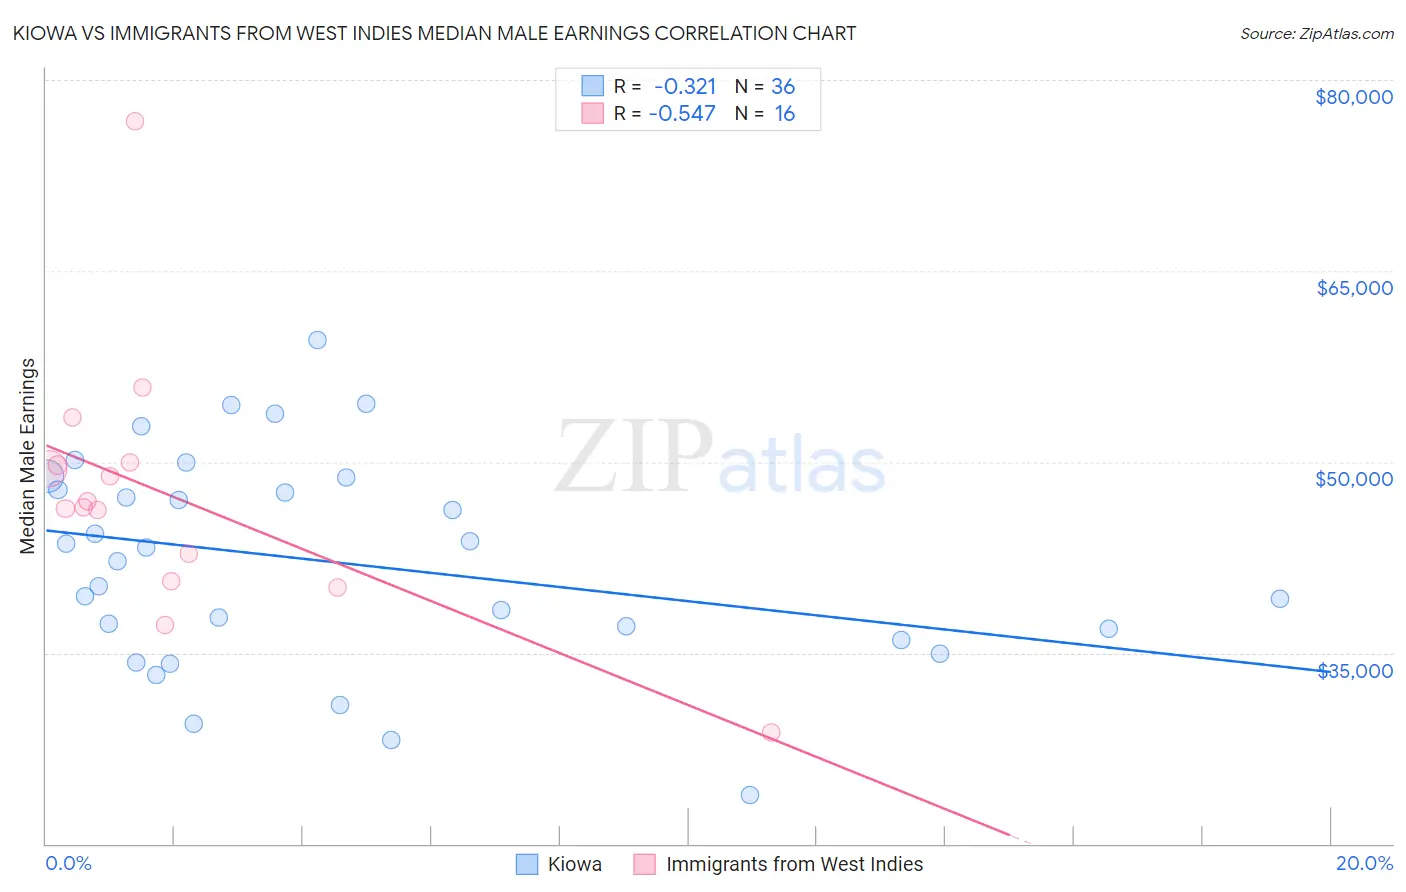
Kiowa vs Immigrants from West Indies Median Male Earnings Correlation Chart
The statistical analysis conducted on geographies consisting of 56,097,810 people shows a mild negative correlation between the proportion of Kiowa and median male earnings in the United States with a correlation coefficient (R) of -0.321 and weighted average of $45,094. Similarly, the statistical analysis conducted on geographies consisting of 72,416,935 people shows a substantial negative correlation between the proportion of Immigrants from West Indies and median male earnings in the United States with a correlation coefficient (R) of -0.547 and weighted average of $49,271, a difference of 9.3%.
Median Male Earnings Correlation Summary
| Measurement | Kiowa | Immigrants from West Indies |
| Minimum | $23,854 | $28,702 |
| Maximum | $59,583 | $76,711 |
| Range | $35,729 | $48,009 |
| Mean | $42,136 | $47,473 |
| Median | $42,718 | $46,662 |
| Interquartile 25% (IQ1) | $36,490 | $41,722 |
| Interquartile 75% (IQ3) | $48,295 | $49,852 |
| Interquartile Range (IQR) | $11,805 | $8,130 |
| Standard Deviation (Sample) | $8,380 | $10,214 |
| Standard Deviation (Population) | $8,263 | $9,890 |
Similar Demographics by Median Male Earnings
Demographics Similar to Kiowa by Median Male Earnings
In terms of median male earnings, the demographic groups most similar to Kiowa are Immigrants from Bahamas ($45,176, a difference of 0.18%), Yakama ($45,002, a difference of 0.20%), Immigrants from Mexico ($44,960, a difference of 0.30%), Immigrants from Haiti ($45,266, a difference of 0.38%), and Native/Alaskan ($44,775, a difference of 0.71%).
| Demographics | Rating | Rank | Median Male Earnings |
| Fijians | 0.0 /100 | #321 | Tragic $45,607 |
| Sioux | 0.0 /100 | #322 | Tragic $45,566 |
| Immigrants | Central America | 0.0 /100 | #323 | Tragic $45,538 |
| Blacks/African Americans | 0.0 /100 | #324 | Tragic $45,523 |
| Yuman | 0.0 /100 | #325 | Tragic $45,446 |
| Immigrants | Haiti | 0.0 /100 | #326 | Tragic $45,266 |
| Immigrants | Bahamas | 0.0 /100 | #327 | Tragic $45,176 |
| Kiowa | 0.0 /100 | #328 | Tragic $45,094 |
| Yakama | 0.0 /100 | #329 | Tragic $45,002 |
| Immigrants | Mexico | 0.0 /100 | #330 | Tragic $44,960 |
| Natives/Alaskans | 0.0 /100 | #331 | Tragic $44,775 |
| Bahamians | 0.0 /100 | #332 | Tragic $44,756 |
| Immigrants | Congo | 0.0 /100 | #333 | Tragic $44,204 |
| Immigrants | Yemen | 0.0 /100 | #334 | Tragic $44,083 |
| Spanish American Indians | 0.0 /100 | #335 | Tragic $44,010 |
Demographics Similar to Immigrants from West Indies by Median Male Earnings
In terms of median male earnings, the demographic groups most similar to Immigrants from West Indies are Liberian ($49,318, a difference of 0.10%), Nicaraguan ($49,215, a difference of 0.11%), Immigrants from Middle Africa ($49,201, a difference of 0.14%), Immigrants from Laos ($49,190, a difference of 0.16%), and Iroquois ($49,374, a difference of 0.21%).
| Demographics | Rating | Rank | Median Male Earnings |
| Alaskan Athabascans | 0.9 /100 | #255 | Tragic $49,748 |
| Alaska Natives | 0.9 /100 | #256 | Tragic $49,711 |
| British West Indians | 0.8 /100 | #257 | Tragic $49,636 |
| Cree | 0.7 /100 | #258 | Tragic $49,497 |
| Nepalese | 0.7 /100 | #259 | Tragic $49,458 |
| Iroquois | 0.7 /100 | #260 | Tragic $49,374 |
| Liberians | 0.6 /100 | #261 | Tragic $49,318 |
| Immigrants | West Indies | 0.6 /100 | #262 | Tragic $49,271 |
| Nicaraguans | 0.6 /100 | #263 | Tragic $49,215 |
| Immigrants | Middle Africa | 0.6 /100 | #264 | Tragic $49,201 |
| Immigrants | Laos | 0.6 /100 | #265 | Tragic $49,190 |
| Somalis | 0.5 /100 | #266 | Tragic $49,025 |
| Spanish Americans | 0.5 /100 | #267 | Tragic $49,008 |
| Ute | 0.4 /100 | #268 | Tragic $48,899 |
| Tsimshian | 0.4 /100 | #269 | Tragic $48,836 |