Immigrants from Romania vs Immigrants from Congo Median Male Earnings
COMPARE
Immigrants from Romania
Immigrants from Congo
Median Male Earnings
Median Male Earnings Comparison
Immigrants from Romania
Immigrants from Congo
$61,040
MEDIAN MALE EARNINGS
99.8/ 100
METRIC RATING
62nd/ 347
METRIC RANK
$44,204
MEDIAN MALE EARNINGS
0.0/ 100
METRIC RATING
333rd/ 347
METRIC RANK
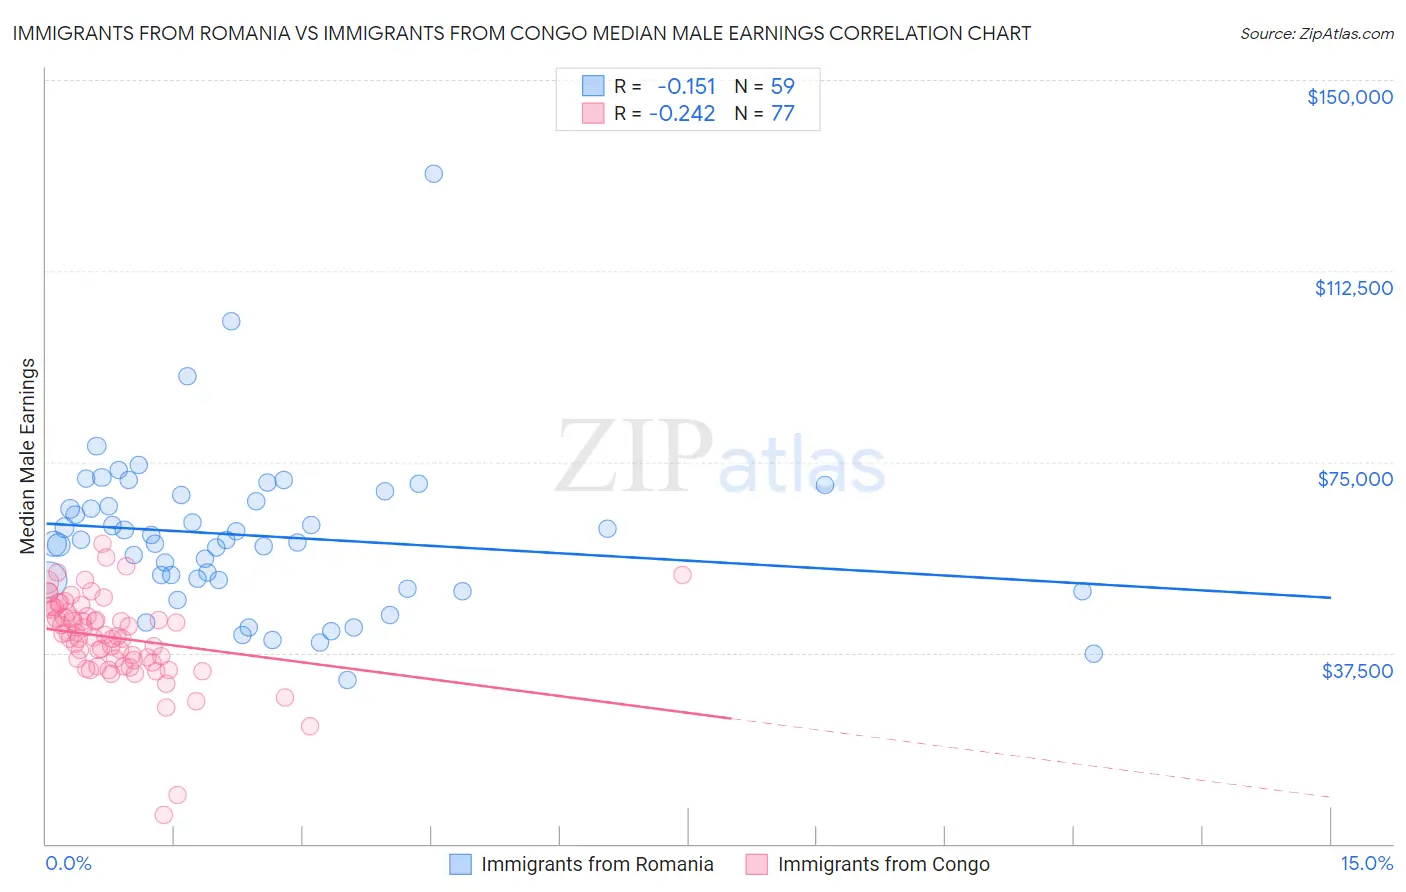
Immigrants from Romania vs Immigrants from Congo Median Male Earnings Correlation Chart
The statistical analysis conducted on geographies consisting of 256,975,343 people shows a poor negative correlation between the proportion of Immigrants from Romania and median male earnings in the United States with a correlation coefficient (R) of -0.151 and weighted average of $61,040. Similarly, the statistical analysis conducted on geographies consisting of 92,117,161 people shows a weak negative correlation between the proportion of Immigrants from Congo and median male earnings in the United States with a correlation coefficient (R) of -0.242 and weighted average of $44,204, a difference of 38.1%.
Median Male Earnings Correlation Summary
| Measurement | Immigrants from Romania | Immigrants from Congo |
| Minimum | $32,206 | $5,667 |
| Maximum | $131,536 | $59,021 |
| Range | $99,330 | $53,354 |
| Mean | $60,508 | $40,451 |
| Median | $59,717 | $40,971 |
| Interquartile 25% (IQ1) | $51,701 | $35,851 |
| Interquartile 75% (IQ3) | $68,594 | $45,724 |
| Interquartile Range (IQR) | $16,893 | $9,873 |
| Standard Deviation (Sample) | $15,927 | $8,754 |
| Standard Deviation (Population) | $15,791 | $8,697 |
Similar Demographics by Median Male Earnings
Demographics Similar to Immigrants from Romania by Median Male Earnings
In terms of median male earnings, the demographic groups most similar to Immigrants from Romania are Bolivian ($61,066, a difference of 0.040%), Immigrants from Netherlands ($61,096, a difference of 0.090%), Egyptian ($61,095, a difference of 0.090%), Immigrants from Pakistan ($60,987, a difference of 0.090%), and Immigrants from Eastern Europe ($60,958, a difference of 0.13%).
| Demographics | Rating | Rank | Median Male Earnings |
| Greeks | 99.9 /100 | #55 | Exceptional $61,242 |
| Lithuanians | 99.9 /100 | #56 | Exceptional $61,228 |
| Immigrants | Scotland | 99.9 /100 | #57 | Exceptional $61,220 |
| New Zealanders | 99.9 /100 | #58 | Exceptional $61,199 |
| Immigrants | Netherlands | 99.8 /100 | #59 | Exceptional $61,096 |
| Egyptians | 99.8 /100 | #60 | Exceptional $61,095 |
| Bolivians | 99.8 /100 | #61 | Exceptional $61,066 |
| Immigrants | Romania | 99.8 /100 | #62 | Exceptional $61,040 |
| Immigrants | Pakistan | 99.8 /100 | #63 | Exceptional $60,987 |
| Immigrants | Eastern Europe | 99.8 /100 | #64 | Exceptional $60,958 |
| Immigrants | Indonesia | 99.8 /100 | #65 | Exceptional $60,935 |
| Immigrants | Croatia | 99.8 /100 | #66 | Exceptional $60,914 |
| Immigrants | Spain | 99.8 /100 | #67 | Exceptional $60,750 |
| Immigrants | Serbia | 99.7 /100 | #68 | Exceptional $60,600 |
| Immigrants | Canada | 99.7 /100 | #69 | Exceptional $60,388 |
Demographics Similar to Immigrants from Congo by Median Male Earnings
In terms of median male earnings, the demographic groups most similar to Immigrants from Congo are Immigrants from Yemen ($44,083, a difference of 0.27%), Spanish American Indian ($44,010, a difference of 0.44%), Bahamian ($44,756, a difference of 1.3%), Native/Alaskan ($44,775, a difference of 1.3%), and Immigrants from Mexico ($44,960, a difference of 1.7%).
| Demographics | Rating | Rank | Median Male Earnings |
| Immigrants | Haiti | 0.0 /100 | #326 | Tragic $45,266 |
| Immigrants | Bahamas | 0.0 /100 | #327 | Tragic $45,176 |
| Kiowa | 0.0 /100 | #328 | Tragic $45,094 |
| Yakama | 0.0 /100 | #329 | Tragic $45,002 |
| Immigrants | Mexico | 0.0 /100 | #330 | Tragic $44,960 |
| Natives/Alaskans | 0.0 /100 | #331 | Tragic $44,775 |
| Bahamians | 0.0 /100 | #332 | Tragic $44,756 |
| Immigrants | Congo | 0.0 /100 | #333 | Tragic $44,204 |
| Immigrants | Yemen | 0.0 /100 | #334 | Tragic $44,083 |
| Spanish American Indians | 0.0 /100 | #335 | Tragic $44,010 |
| Immigrants | Cuba | 0.0 /100 | #336 | Tragic $43,461 |
| Menominee | 0.0 /100 | #337 | Tragic $42,581 |
| Crow | 0.0 /100 | #338 | Tragic $42,434 |
| Pima | 0.0 /100 | #339 | Tragic $42,357 |
| Navajo | 0.0 /100 | #340 | Tragic $42,098 |