Basque vs Immigrants from Congo Median Male Earnings
COMPARE
Basque
Immigrants from Congo
Median Male Earnings
Median Male Earnings Comparison
Basques
Immigrants from Congo
$55,370
MEDIAN MALE EARNINGS
70.3/ 100
METRIC RATING
160th/ 347
METRIC RANK
$44,204
MEDIAN MALE EARNINGS
0.0/ 100
METRIC RATING
333rd/ 347
METRIC RANK
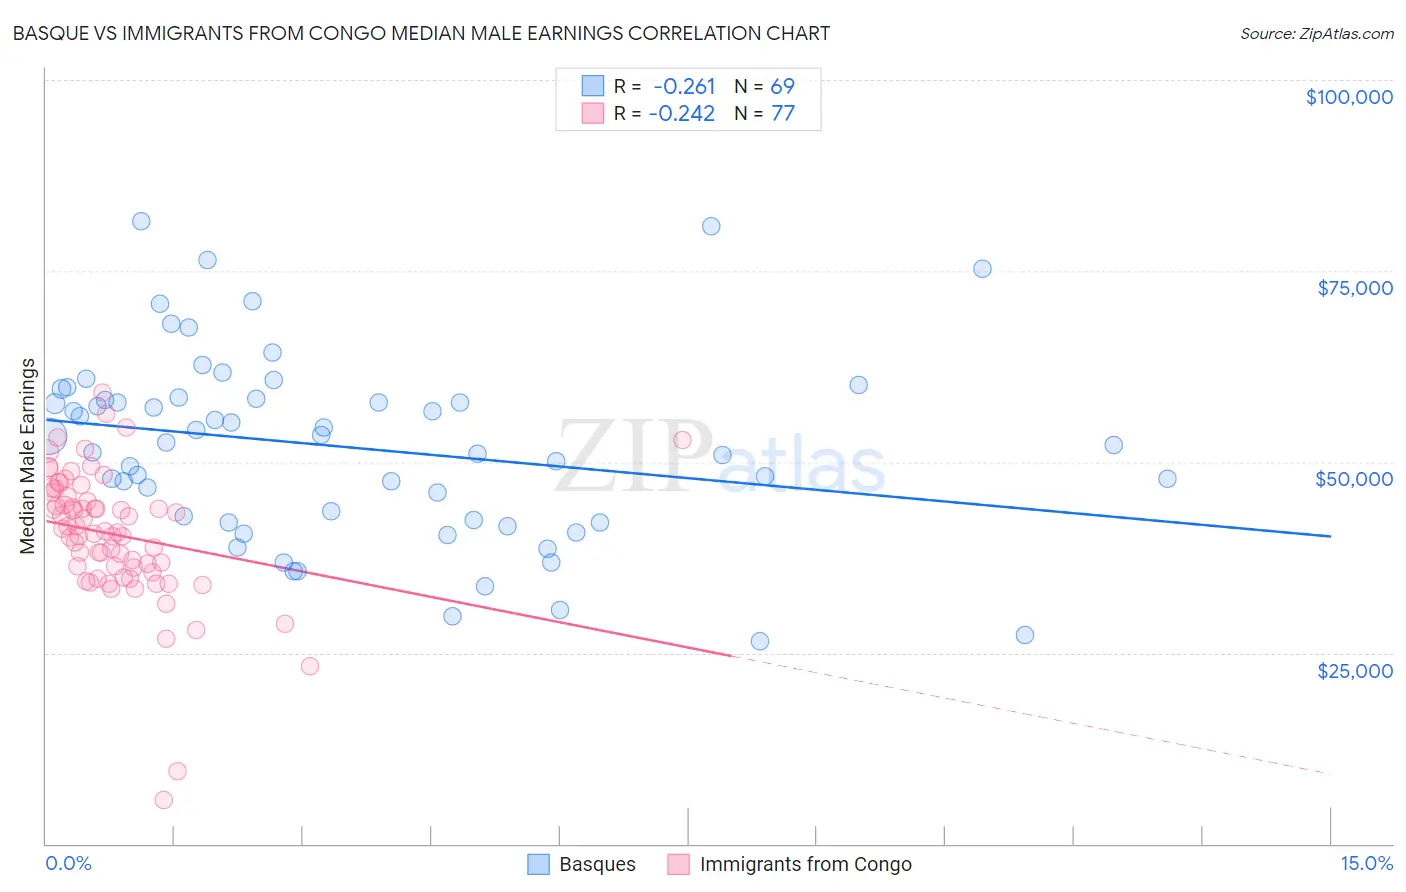
Basque vs Immigrants from Congo Median Male Earnings Correlation Chart
The statistical analysis conducted on geographies consisting of 165,750,902 people shows a weak negative correlation between the proportion of Basques and median male earnings in the United States with a correlation coefficient (R) of -0.261 and weighted average of $55,370. Similarly, the statistical analysis conducted on geographies consisting of 92,117,161 people shows a weak negative correlation between the proportion of Immigrants from Congo and median male earnings in the United States with a correlation coefficient (R) of -0.242 and weighted average of $44,204, a difference of 25.3%.
Median Male Earnings Correlation Summary
| Measurement | Basque | Immigrants from Congo |
| Minimum | $26,442 | $5,667 |
| Maximum | $81,428 | $59,021 |
| Range | $54,986 | $53,354 |
| Mean | $51,886 | $40,451 |
| Median | $52,492 | $40,971 |
| Interquartile 25% (IQ1) | $42,224 | $35,851 |
| Interquartile 75% (IQ3) | $58,280 | $45,724 |
| Interquartile Range (IQR) | $16,056 | $9,873 |
| Standard Deviation (Sample) | $12,223 | $8,754 |
| Standard Deviation (Population) | $12,134 | $8,697 |
Similar Demographics by Median Male Earnings
Demographics Similar to Basques by Median Male Earnings
In terms of median male earnings, the demographic groups most similar to Basques are Czechoslovakian ($55,382, a difference of 0.020%), Alsatian ($55,380, a difference of 0.020%), Belgian ($55,361, a difference of 0.020%), French ($55,350, a difference of 0.040%), and Icelander ($55,415, a difference of 0.080%).
| Demographics | Rating | Rank | Median Male Earnings |
| Immigrants | Nepal | 75.0 /100 | #153 | Good $55,615 |
| Taiwanese | 73.9 /100 | #154 | Good $55,556 |
| Scandinavians | 73.4 /100 | #155 | Good $55,527 |
| Immigrants | Ethiopia | 71.6 /100 | #156 | Good $55,434 |
| Icelanders | 71.2 /100 | #157 | Good $55,415 |
| Czechoslovakians | 70.5 /100 | #158 | Good $55,382 |
| Alsatians | 70.5 /100 | #159 | Good $55,380 |
| Basques | 70.3 /100 | #160 | Good $55,370 |
| Belgians | 70.1 /100 | #161 | Good $55,361 |
| French | 69.9 /100 | #162 | Good $55,350 |
| Ugandans | 68.6 /100 | #163 | Good $55,290 |
| Immigrants | South Eastern Asia | 67.6 /100 | #164 | Good $55,241 |
| Immigrants | Portugal | 66.3 /100 | #165 | Good $55,182 |
| Germans | 61.6 /100 | #166 | Good $54,974 |
| Immigrants | Fiji | 61.2 /100 | #167 | Good $54,958 |
Demographics Similar to Immigrants from Congo by Median Male Earnings
In terms of median male earnings, the demographic groups most similar to Immigrants from Congo are Immigrants from Yemen ($44,083, a difference of 0.27%), Spanish American Indian ($44,010, a difference of 0.44%), Bahamian ($44,756, a difference of 1.3%), Native/Alaskan ($44,775, a difference of 1.3%), and Immigrants from Mexico ($44,960, a difference of 1.7%).
| Demographics | Rating | Rank | Median Male Earnings |
| Immigrants | Haiti | 0.0 /100 | #326 | Tragic $45,266 |
| Immigrants | Bahamas | 0.0 /100 | #327 | Tragic $45,176 |
| Kiowa | 0.0 /100 | #328 | Tragic $45,094 |
| Yakama | 0.0 /100 | #329 | Tragic $45,002 |
| Immigrants | Mexico | 0.0 /100 | #330 | Tragic $44,960 |
| Natives/Alaskans | 0.0 /100 | #331 | Tragic $44,775 |
| Bahamians | 0.0 /100 | #332 | Tragic $44,756 |
| Immigrants | Congo | 0.0 /100 | #333 | Tragic $44,204 |
| Immigrants | Yemen | 0.0 /100 | #334 | Tragic $44,083 |
| Spanish American Indians | 0.0 /100 | #335 | Tragic $44,010 |
| Immigrants | Cuba | 0.0 /100 | #336 | Tragic $43,461 |
| Menominee | 0.0 /100 | #337 | Tragic $42,581 |
| Crow | 0.0 /100 | #338 | Tragic $42,434 |
| Pima | 0.0 /100 | #339 | Tragic $42,357 |
| Navajo | 0.0 /100 | #340 | Tragic $42,098 |