African vs Immigrants from Congo Median Male Earnings
COMPARE
African
Immigrants from Congo
Median Male Earnings
Median Male Earnings Comparison
Africans
Immigrants from Congo
$47,994
MEDIAN MALE EARNINGS
0.2/ 100
METRIC RATING
284th/ 347
METRIC RANK
$44,204
MEDIAN MALE EARNINGS
0.0/ 100
METRIC RATING
333rd/ 347
METRIC RANK
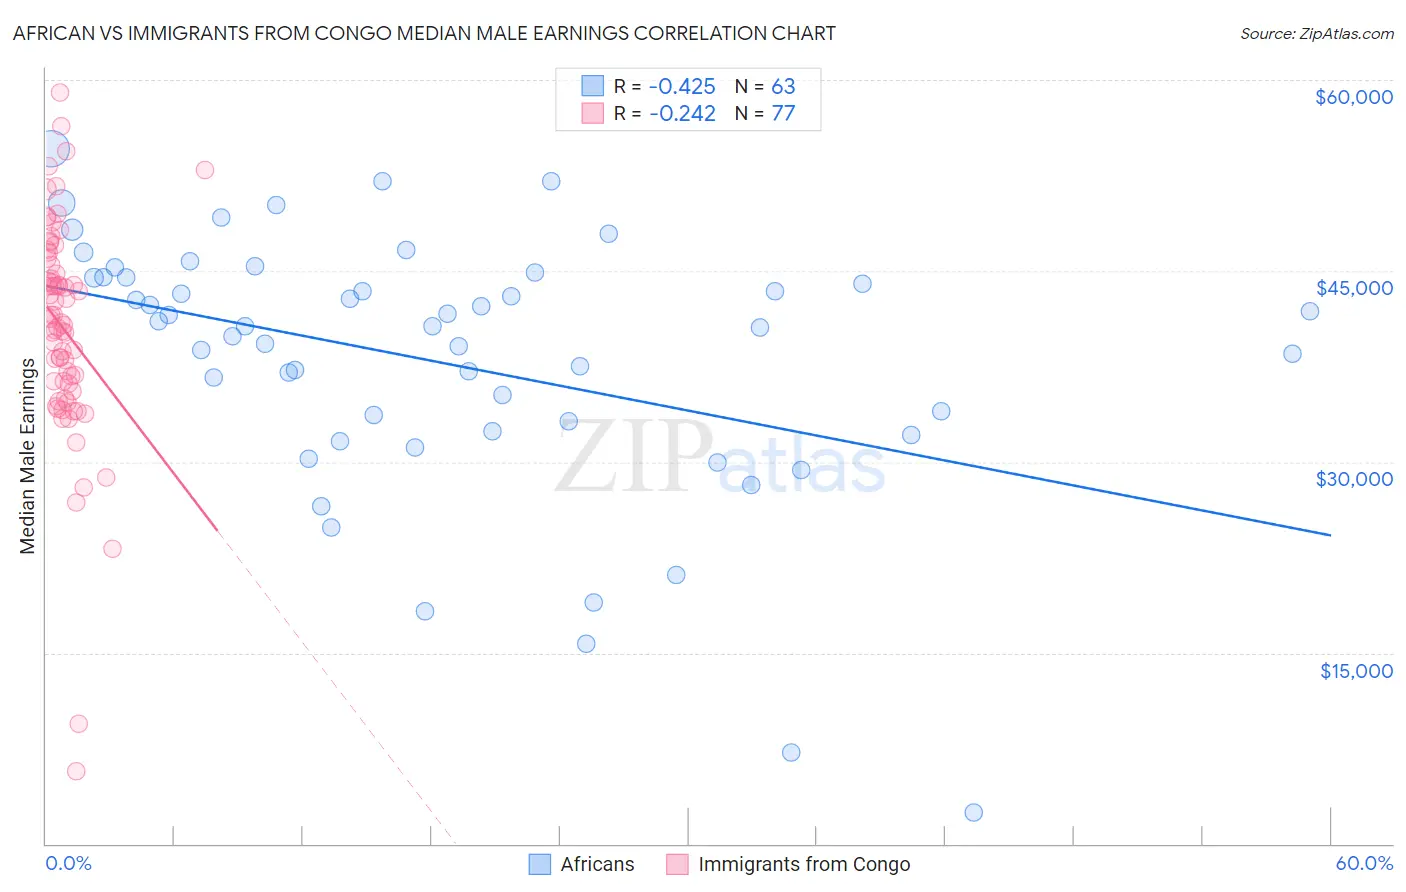
African vs Immigrants from Congo Median Male Earnings Correlation Chart
The statistical analysis conducted on geographies consisting of 469,793,232 people shows a moderate negative correlation between the proportion of Africans and median male earnings in the United States with a correlation coefficient (R) of -0.425 and weighted average of $47,994. Similarly, the statistical analysis conducted on geographies consisting of 92,117,161 people shows a weak negative correlation between the proportion of Immigrants from Congo and median male earnings in the United States with a correlation coefficient (R) of -0.242 and weighted average of $44,204, a difference of 8.6%.
Median Male Earnings Correlation Summary
| Measurement | African | Immigrants from Congo |
| Minimum | $2,499 | $5,667 |
| Maximum | $54,569 | $59,021 |
| Range | $52,070 | $53,354 |
| Mean | $37,853 | $40,451 |
| Median | $40,627 | $40,971 |
| Interquartile 25% (IQ1) | $32,413 | $35,851 |
| Interquartile 75% (IQ3) | $44,491 | $45,724 |
| Interquartile Range (IQR) | $12,079 | $9,873 |
| Standard Deviation (Sample) | $10,360 | $8,754 |
| Standard Deviation (Population) | $10,278 | $8,697 |
Similar Demographics by Median Male Earnings
Demographics Similar to Africans by Median Male Earnings
In terms of median male earnings, the demographic groups most similar to Africans are Paiute ($47,991, a difference of 0.010%), Mexican American Indian ($47,990, a difference of 0.010%), Immigrants from El Salvador ($47,973, a difference of 0.040%), Immigrants from Jamaica ($48,040, a difference of 0.090%), and Shoshone ($47,930, a difference of 0.13%).
| Demographics | Rating | Rank | Median Male Earnings |
| Belizeans | 0.2 /100 | #277 | Tragic $48,358 |
| Immigrants | Liberia | 0.2 /100 | #278 | Tragic $48,317 |
| Hmong | 0.2 /100 | #279 | Tragic $48,254 |
| Comanche | 0.2 /100 | #280 | Tragic $48,202 |
| Marshallese | 0.2 /100 | #281 | Tragic $48,137 |
| Central Americans | 0.2 /100 | #282 | Tragic $48,093 |
| Immigrants | Jamaica | 0.2 /100 | #283 | Tragic $48,040 |
| Africans | 0.2 /100 | #284 | Tragic $47,994 |
| Paiute | 0.2 /100 | #285 | Tragic $47,991 |
| Mexican American Indians | 0.2 /100 | #286 | Tragic $47,990 |
| Immigrants | El Salvador | 0.2 /100 | #287 | Tragic $47,973 |
| Shoshone | 0.2 /100 | #288 | Tragic $47,930 |
| Chickasaw | 0.1 /100 | #289 | Tragic $47,832 |
| Immigrants | Belize | 0.1 /100 | #290 | Tragic $47,809 |
| Choctaw | 0.1 /100 | #291 | Tragic $47,729 |
Demographics Similar to Immigrants from Congo by Median Male Earnings
In terms of median male earnings, the demographic groups most similar to Immigrants from Congo are Immigrants from Yemen ($44,083, a difference of 0.27%), Spanish American Indian ($44,010, a difference of 0.44%), Bahamian ($44,756, a difference of 1.3%), Native/Alaskan ($44,775, a difference of 1.3%), and Immigrants from Mexico ($44,960, a difference of 1.7%).
| Demographics | Rating | Rank | Median Male Earnings |
| Immigrants | Haiti | 0.0 /100 | #326 | Tragic $45,266 |
| Immigrants | Bahamas | 0.0 /100 | #327 | Tragic $45,176 |
| Kiowa | 0.0 /100 | #328 | Tragic $45,094 |
| Yakama | 0.0 /100 | #329 | Tragic $45,002 |
| Immigrants | Mexico | 0.0 /100 | #330 | Tragic $44,960 |
| Natives/Alaskans | 0.0 /100 | #331 | Tragic $44,775 |
| Bahamians | 0.0 /100 | #332 | Tragic $44,756 |
| Immigrants | Congo | 0.0 /100 | #333 | Tragic $44,204 |
| Immigrants | Yemen | 0.0 /100 | #334 | Tragic $44,083 |
| Spanish American Indians | 0.0 /100 | #335 | Tragic $44,010 |
| Immigrants | Cuba | 0.0 /100 | #336 | Tragic $43,461 |
| Menominee | 0.0 /100 | #337 | Tragic $42,581 |
| Crow | 0.0 /100 | #338 | Tragic $42,434 |
| Pima | 0.0 /100 | #339 | Tragic $42,357 |
| Navajo | 0.0 /100 | #340 | Tragic $42,098 |