Assyrian/Chaldean/Syriac vs Immigrants from Congo 4th Grade
COMPARE
Assyrian/Chaldean/Syriac
Immigrants from Congo
4th Grade
4th Grade Comparison
Assyrians/Chaldeans/Syriacs
Immigrants from Congo
97.2%
4TH GRADE
3.0/ 100
METRIC RATING
234th/ 347
METRIC RANK
97.0%
4TH GRADE
0.5/ 100
METRIC RATING
257th/ 347
METRIC RANK
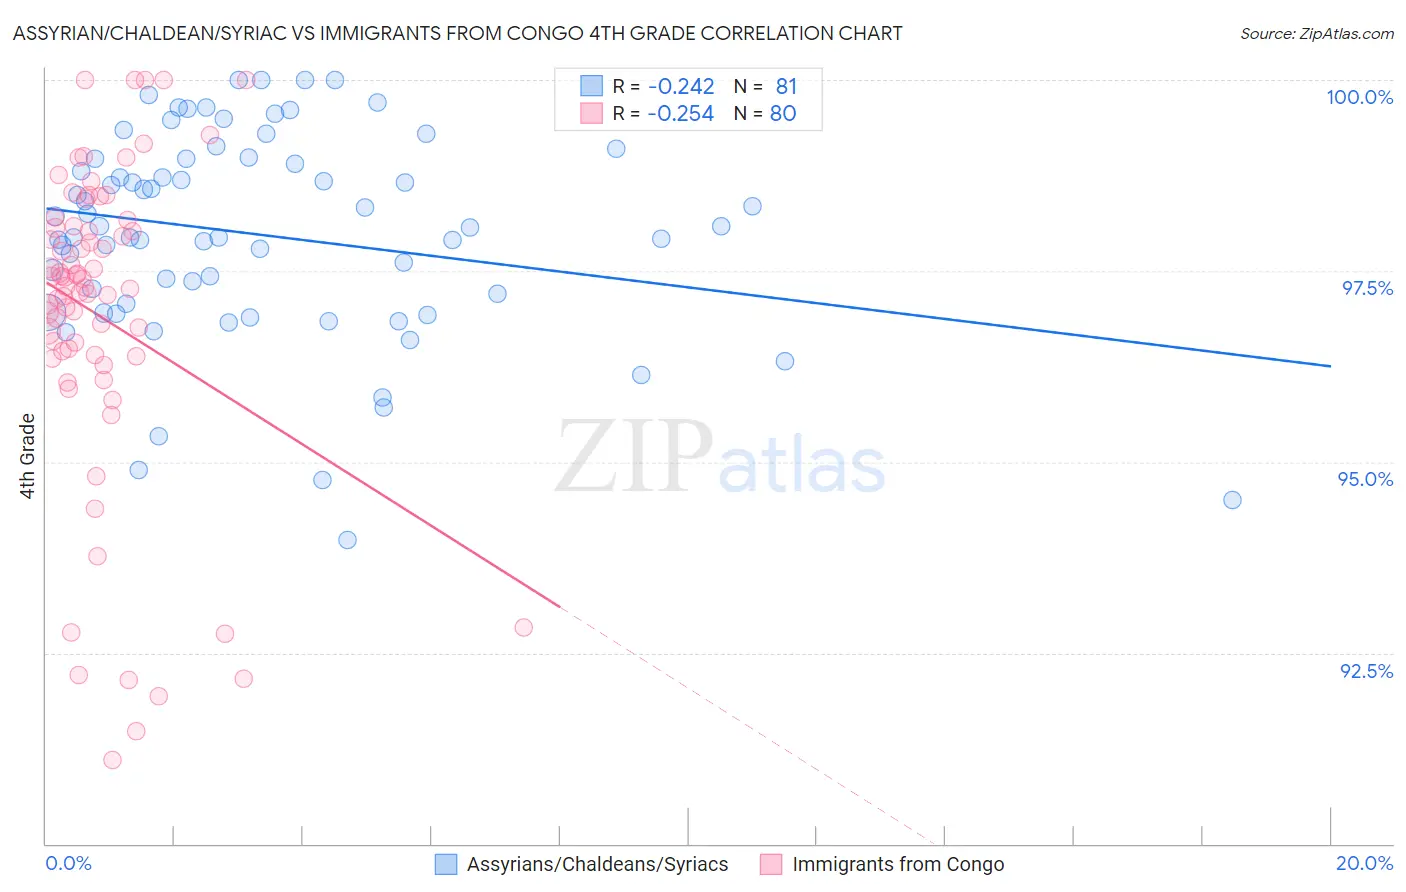
Assyrian/Chaldean/Syriac vs Immigrants from Congo 4th Grade Correlation Chart
The statistical analysis conducted on geographies consisting of 110,318,304 people shows a weak negative correlation between the proportion of Assyrians/Chaldeans/Syriacs and percentage of population with at least 4th grade education in the United States with a correlation coefficient (R) of -0.242 and weighted average of 97.2%. Similarly, the statistical analysis conducted on geographies consisting of 92,124,753 people shows a weak negative correlation between the proportion of Immigrants from Congo and percentage of population with at least 4th grade education in the United States with a correlation coefficient (R) of -0.254 and weighted average of 97.0%, a difference of 0.18%.
4th Grade Correlation Summary
| Measurement | Assyrian/Chaldean/Syriac | Immigrants from Congo |
| Minimum | 94.0% | 91.1% |
| Maximum | 100.0% | 100.0% |
| Range | 6.0% | 8.9% |
| Mean | 98.0% | 96.9% |
| Median | 98.1% | 97.3% |
| Interquartile 25% (IQ1) | 97.0% | 96.4% |
| Interquartile 75% (IQ3) | 99.0% | 98.1% |
| Interquartile Range (IQR) | 2.0% | 1.7% |
| Standard Deviation (Sample) | 1.4% | 2.1% |
| Standard Deviation (Population) | 1.3% | 2.1% |
Similar Demographics by 4th Grade
Demographics Similar to Assyrians/Chaldeans/Syriacs by 4th Grade
In terms of 4th grade, the demographic groups most similar to Assyrians/Chaldeans/Syriacs are Senegalese (97.2%, a difference of 0.0%), Yuman (97.2%, a difference of 0.0%), Immigrants from Malaysia (97.2%, a difference of 0.010%), Immigrants from Western Asia (97.2%, a difference of 0.010%), and Immigrants from Eastern Asia (97.2%, a difference of 0.010%).
| Demographics | Rating | Rank | 4th Grade |
| Immigrants | Pakistan | 3.7 /100 | #227 | Tragic 97.2% |
| Sub-Saharan Africans | 3.6 /100 | #228 | Tragic 97.2% |
| Liberians | 3.6 /100 | #229 | Tragic 97.2% |
| Uruguayans | 3.5 /100 | #230 | Tragic 97.2% |
| Immigrants | Malaysia | 3.4 /100 | #231 | Tragic 97.2% |
| Immigrants | Western Asia | 3.4 /100 | #232 | Tragic 97.2% |
| Senegalese | 3.1 /100 | #233 | Tragic 97.2% |
| Assyrians/Chaldeans/Syriacs | 3.0 /100 | #234 | Tragic 97.2% |
| Yuman | 2.9 /100 | #235 | Tragic 97.2% |
| Immigrants | Eastern Asia | 2.7 /100 | #236 | Tragic 97.2% |
| Immigrants | Costa Rica | 2.0 /100 | #237 | Tragic 97.2% |
| Indians (Asian) | 1.9 /100 | #238 | Tragic 97.2% |
| Nigerians | 1.8 /100 | #239 | Tragic 97.1% |
| Colombians | 1.6 /100 | #240 | Tragic 97.1% |
| Immigrants | Indonesia | 1.5 /100 | #241 | Tragic 97.1% |
Demographics Similar to Immigrants from Congo by 4th Grade
In terms of 4th grade, the demographic groups most similar to Immigrants from Congo are Immigrants from Colombia (97.0%, a difference of 0.0%), Immigrants from Ethiopia (97.0%, a difference of 0.010%), Immigrants from Sierra Leone (97.0%, a difference of 0.020%), Immigrants from South America (97.0%, a difference of 0.020%), and West Indian (97.0%, a difference of 0.030%).
| Demographics | Rating | Rank | 4th Grade |
| Immigrants | Senegal | 0.9 /100 | #250 | Tragic 97.1% |
| South Americans | 0.8 /100 | #251 | Tragic 97.1% |
| Jamaicans | 0.8 /100 | #252 | Tragic 97.1% |
| Immigrants | Liberia | 0.8 /100 | #253 | Tragic 97.1% |
| Immigrants | Middle Africa | 0.8 /100 | #254 | Tragic 97.1% |
| Peruvians | 0.7 /100 | #255 | Tragic 97.1% |
| Bolivians | 0.7 /100 | #256 | Tragic 97.1% |
| Immigrants | Congo | 0.5 /100 | #257 | Tragic 97.0% |
| Immigrants | Colombia | 0.5 /100 | #258 | Tragic 97.0% |
| Immigrants | Ethiopia | 0.4 /100 | #259 | Tragic 97.0% |
| Immigrants | Sierra Leone | 0.4 /100 | #260 | Tragic 97.0% |
| Immigrants | South America | 0.4 /100 | #261 | Tragic 97.0% |
| West Indians | 0.4 /100 | #262 | Tragic 97.0% |
| Immigrants | Jamaica | 0.3 /100 | #263 | Tragic 97.0% |
| Taiwanese | 0.3 /100 | #264 | Tragic 97.0% |