Assyrian/Chaldean/Syriac vs Immigrants from Congo In Labor Force | Age 35-44
COMPARE
Assyrian/Chaldean/Syriac
Immigrants from Congo
In Labor Force | Age 35-44
In Labor Force | Age 35-44 Comparison
Assyrians/Chaldeans/Syriacs
Immigrants from Congo
84.0%
IN LABOR FORCE | AGE 35-44
6.6/ 100
METRIC RATING
222nd/ 347
METRIC RANK
83.5%
IN LABOR FORCE | AGE 35-44
0.2/ 100
METRIC RATING
262nd/ 347
METRIC RANK
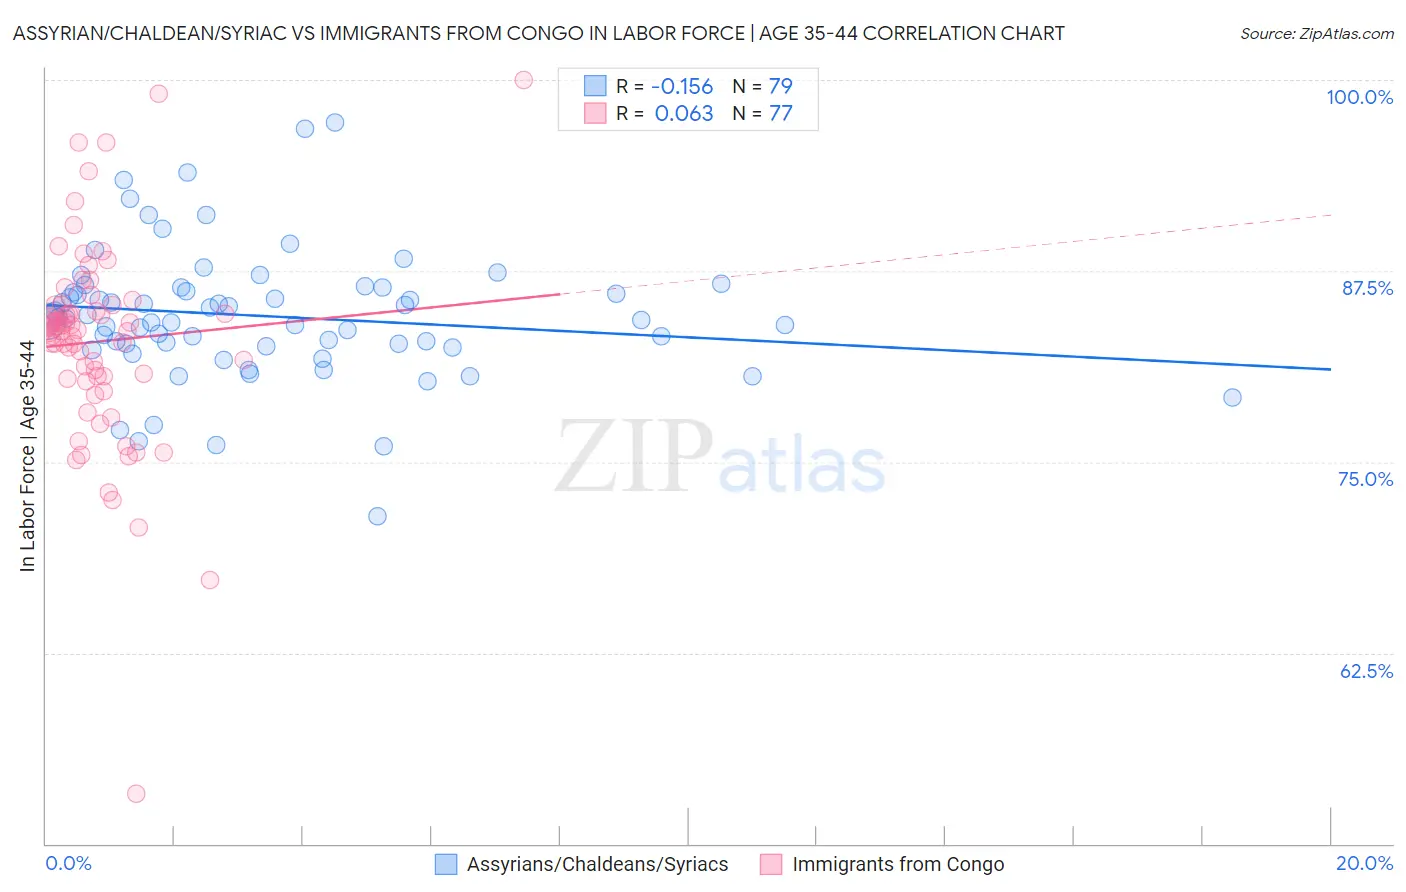
Assyrian/Chaldean/Syriac vs Immigrants from Congo In Labor Force | Age 35-44 Correlation Chart
The statistical analysis conducted on geographies consisting of 110,311,119 people shows a poor negative correlation between the proportion of Assyrians/Chaldeans/Syriacs and labor force participation rate among population between the ages 35 and 44 in the United States with a correlation coefficient (R) of -0.156 and weighted average of 84.0%. Similarly, the statistical analysis conducted on geographies consisting of 92,106,989 people shows a slight positive correlation between the proportion of Immigrants from Congo and labor force participation rate among population between the ages 35 and 44 in the United States with a correlation coefficient (R) of 0.063 and weighted average of 83.5%, a difference of 0.59%.
In Labor Force | Age 35-44 Correlation Summary
| Measurement | Assyrian/Chaldean/Syriac | Immigrants from Congo |
| Minimum | 71.4% | 53.3% |
| Maximum | 97.2% | 100.0% |
| Range | 25.8% | 46.7% |
| Mean | 84.5% | 82.9% |
| Median | 84.4% | 83.6% |
| Interquartile 25% (IQ1) | 82.6% | 80.5% |
| Interquartile 75% (IQ3) | 86.4% | 85.3% |
| Interquartile Range (IQR) | 3.8% | 4.7% |
| Standard Deviation (Sample) | 4.3% | 6.7% |
| Standard Deviation (Population) | 4.3% | 6.7% |
Similar Demographics by In Labor Force | Age 35-44
Demographics Similar to Assyrians/Chaldeans/Syriacs by In Labor Force | Age 35-44
In terms of in labor force | age 35-44, the demographic groups most similar to Assyrians/Chaldeans/Syriacs are Icelander (84.0%, a difference of 0.0%), Immigrants from Panama (84.0%, a difference of 0.0%), U.S. Virgin Islander (84.0%, a difference of 0.010%), Immigrants from Burma/Myanmar (84.0%, a difference of 0.010%), and French (84.0%, a difference of 0.020%).
| Demographics | Rating | Rank | In Labor Force | Age 35-44 |
| Europeans | 12.2 /100 | #215 | Poor 84.1% |
| Nicaraguans | 12.1 /100 | #216 | Poor 84.1% |
| Immigrants | Norway | 11.7 /100 | #217 | Poor 84.1% |
| Immigrants | Nicaragua | 9.4 /100 | #218 | Tragic 84.1% |
| Sub-Saharan Africans | 9.3 /100 | #219 | Tragic 84.1% |
| French | 7.5 /100 | #220 | Tragic 84.0% |
| Icelanders | 6.7 /100 | #221 | Tragic 84.0% |
| Assyrians/Chaldeans/Syriacs | 6.6 /100 | #222 | Tragic 84.0% |
| Immigrants | Panama | 6.4 /100 | #223 | Tragic 84.0% |
| U.S. Virgin Islanders | 6.1 /100 | #224 | Tragic 84.0% |
| Immigrants | Burma/Myanmar | 6.1 /100 | #225 | Tragic 84.0% |
| Panamanians | 5.4 /100 | #226 | Tragic 84.0% |
| British West Indians | 5.3 /100 | #227 | Tragic 84.0% |
| Welsh | 5.3 /100 | #228 | Tragic 84.0% |
| Immigrants | Thailand | 4.7 /100 | #229 | Tragic 84.0% |
Demographics Similar to Immigrants from Congo by In Labor Force | Age 35-44
In terms of in labor force | age 35-44, the demographic groups most similar to Immigrants from Congo are Vietnamese (83.5%, a difference of 0.010%), Immigrants from Dominica (83.5%, a difference of 0.010%), Immigrants from El Salvador (83.5%, a difference of 0.020%), Iroquois (83.5%, a difference of 0.030%), and Tsimshian (83.5%, a difference of 0.040%).
| Demographics | Rating | Rank | In Labor Force | Age 35-44 |
| Immigrants | Azores | 0.3 /100 | #255 | Tragic 83.6% |
| Japanese | 0.3 /100 | #256 | Tragic 83.6% |
| Basques | 0.3 /100 | #257 | Tragic 83.6% |
| Tsimshian | 0.2 /100 | #258 | Tragic 83.5% |
| Immigrants | El Salvador | 0.2 /100 | #259 | Tragic 83.5% |
| Vietnamese | 0.2 /100 | #260 | Tragic 83.5% |
| Immigrants | Dominica | 0.2 /100 | #261 | Tragic 83.5% |
| Immigrants | Congo | 0.2 /100 | #262 | Tragic 83.5% |
| Iroquois | 0.2 /100 | #263 | Tragic 83.5% |
| Scotch-Irish | 0.1 /100 | #264 | Tragic 83.5% |
| Central Americans | 0.1 /100 | #265 | Tragic 83.5% |
| Spaniards | 0.1 /100 | #266 | Tragic 83.4% |
| Guamanians/Chamorros | 0.1 /100 | #267 | Tragic 83.4% |
| Hondurans | 0.1 /100 | #268 | Tragic 83.4% |
| Immigrants | Grenada | 0.1 /100 | #269 | Tragic 83.3% |