Argentinean vs Spanish American Indian Median Household Income
COMPARE
Argentinean
Spanish American Indian
Median Household Income
Median Household Income Comparison
Argentineans
Spanish American Indians
$93,960
MEDIAN HOUSEHOLD INCOME
99.7/ 100
METRIC RATING
69th/ 347
METRIC RANK
$76,670
MEDIAN HOUSEHOLD INCOME
0.4/ 100
METRIC RATING
259th/ 347
METRIC RANK
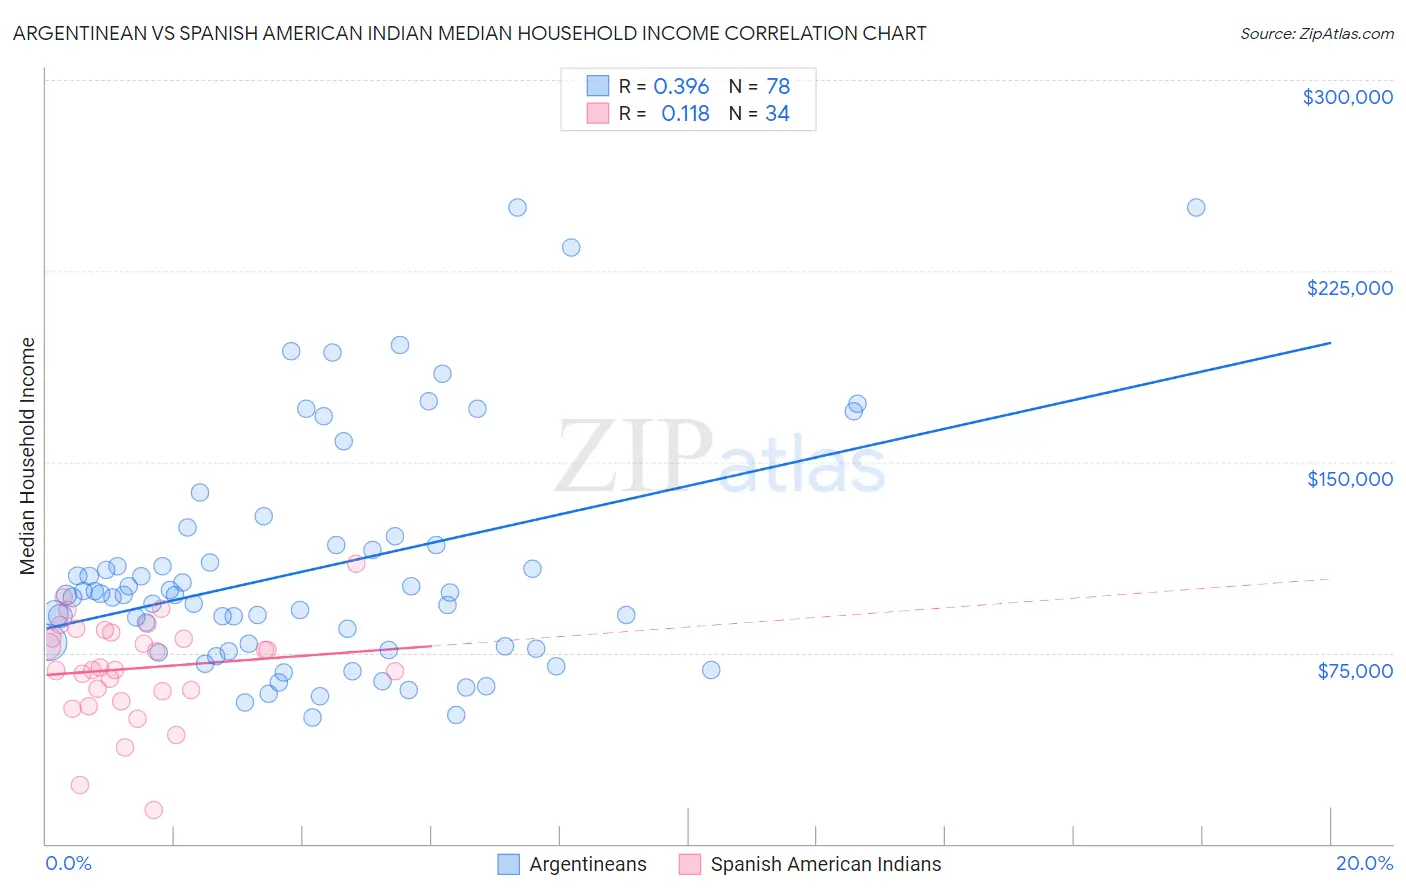
Argentinean vs Spanish American Indian Median Household Income Correlation Chart
The statistical analysis conducted on geographies consisting of 296,944,042 people shows a mild positive correlation between the proportion of Argentineans and median household income in the United States with a correlation coefficient (R) of 0.396 and weighted average of $93,960. Similarly, the statistical analysis conducted on geographies consisting of 73,142,507 people shows a poor positive correlation between the proportion of Spanish American Indians and median household income in the United States with a correlation coefficient (R) of 0.118 and weighted average of $76,670, a difference of 22.6%.
Median Household Income Correlation Summary
| Measurement | Argentinean | Spanish American Indian |
| Minimum | $49,375 | $13,474 |
| Maximum | $250,001 | $110,000 |
| Range | $200,626 | $96,526 |
| Mean | $107,782 | $68,921 |
| Median | $97,608 | $68,901 |
| Interquartile 25% (IQ1) | $76,750 | $59,929 |
| Interquartile 75% (IQ3) | $117,422 | $82,889 |
| Interquartile Range (IQR) | $40,672 | $22,960 |
| Standard Deviation (Sample) | $45,385 | $20,226 |
| Standard Deviation (Population) | $45,093 | $19,926 |
Similar Demographics by Median Household Income
Demographics Similar to Argentineans by Median Household Income
In terms of median household income, the demographic groups most similar to Argentineans are Mongolian ($93,971, a difference of 0.010%), Immigrants from Fiji ($93,933, a difference of 0.030%), Immigrants from Philippines ($93,899, a difference of 0.070%), Lithuanian ($93,852, a difference of 0.11%), and Immigrants from Scotland ($94,091, a difference of 0.14%).
| Demographics | Rating | Rank | Median Household Income |
| Immigrants | Norway | 99.8 /100 | #62 | Exceptional $94,846 |
| Greeks | 99.8 /100 | #63 | Exceptional $94,735 |
| Immigrants | Netherlands | 99.7 /100 | #64 | Exceptional $94,411 |
| Immigrants | Belarus | 99.7 /100 | #65 | Exceptional $94,399 |
| Immigrants | Romania | 99.7 /100 | #66 | Exceptional $94,222 |
| Immigrants | Scotland | 99.7 /100 | #67 | Exceptional $94,091 |
| Mongolians | 99.7 /100 | #68 | Exceptional $93,971 |
| Argentineans | 99.7 /100 | #69 | Exceptional $93,960 |
| Immigrants | Fiji | 99.7 /100 | #70 | Exceptional $93,933 |
| Immigrants | Philippines | 99.6 /100 | #71 | Exceptional $93,899 |
| Lithuanians | 99.6 /100 | #72 | Exceptional $93,852 |
| Immigrants | Egypt | 99.6 /100 | #73 | Exceptional $93,700 |
| Immigrants | Latvia | 99.6 /100 | #74 | Exceptional $93,602 |
| Immigrants | Italy | 99.5 /100 | #75 | Exceptional $93,465 |
| South Africans | 99.5 /100 | #76 | Exceptional $93,379 |
Demographics Similar to Spanish American Indians by Median Household Income
In terms of median household income, the demographic groups most similar to Spanish American Indians are Jamaican ($76,583, a difference of 0.11%), Immigrants from Nicaragua ($76,784, a difference of 0.15%), Immigrants from Grenada ($76,517, a difference of 0.20%), Immigrants from Senegal ($76,915, a difference of 0.32%), and French American Indian ($76,387, a difference of 0.37%).
| Demographics | Rating | Rank | Median Household Income |
| Immigrants | West Indies | 1.0 /100 | #252 | Tragic $77,956 |
| Immigrants | St. Vincent and the Grenadines | 0.9 /100 | #253 | Tragic $77,690 |
| Sub-Saharan Africans | 0.8 /100 | #254 | Tragic $77,631 |
| Immigrants | Middle Africa | 0.8 /100 | #255 | Tragic $77,559 |
| Belizeans | 0.6 /100 | #256 | Tragic $77,028 |
| Immigrants | Senegal | 0.5 /100 | #257 | Tragic $76,915 |
| Immigrants | Nicaragua | 0.5 /100 | #258 | Tragic $76,784 |
| Spanish American Indians | 0.4 /100 | #259 | Tragic $76,670 |
| Jamaicans | 0.4 /100 | #260 | Tragic $76,583 |
| Immigrants | Grenada | 0.4 /100 | #261 | Tragic $76,517 |
| French American Indians | 0.4 /100 | #262 | Tragic $76,387 |
| Alaskan Athabascans | 0.4 /100 | #263 | Tragic $76,383 |
| Guatemalans | 0.3 /100 | #264 | Tragic $75,961 |
| Immigrants | Belize | 0.3 /100 | #265 | Tragic $75,938 |
| Americans | 0.3 /100 | #266 | Tragic $75,932 |