Argentinean vs Immigrants from Northern Europe Median Household Income
COMPARE
Argentinean
Immigrants from Northern Europe
Median Household Income
Median Household Income Comparison
Argentineans
Immigrants from Northern Europe
$93,960
MEDIAN HOUSEHOLD INCOME
99.7/ 100
METRIC RATING
69th/ 347
METRIC RANK
$99,813
MEDIAN HOUSEHOLD INCOME
100.0/ 100
METRIC RATING
30th/ 347
METRIC RANK
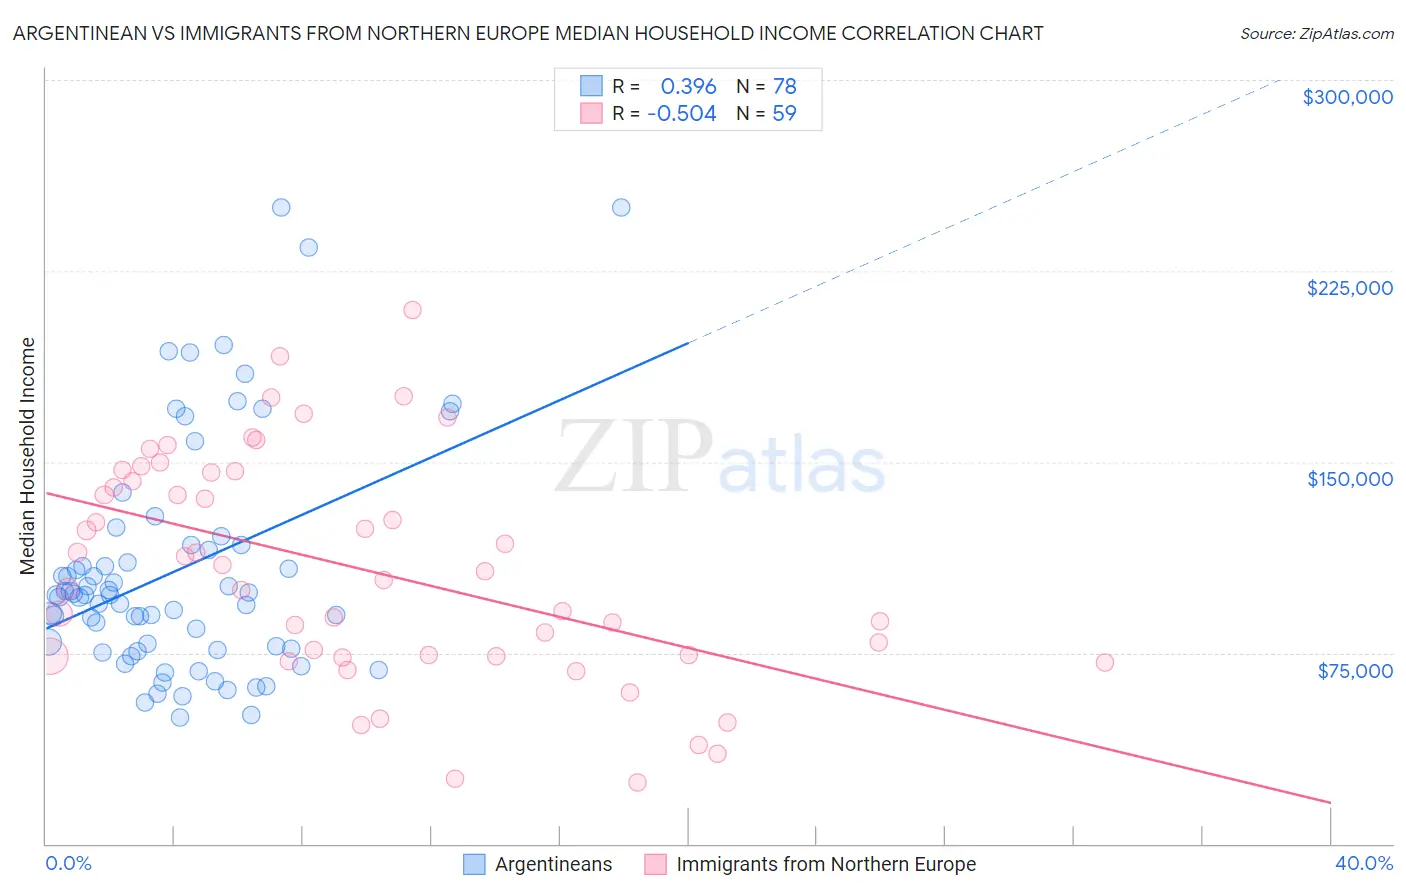
Argentinean vs Immigrants from Northern Europe Median Household Income Correlation Chart
The statistical analysis conducted on geographies consisting of 296,944,042 people shows a mild positive correlation between the proportion of Argentineans and median household income in the United States with a correlation coefficient (R) of 0.396 and weighted average of $93,960. Similarly, the statistical analysis conducted on geographies consisting of 476,802,957 people shows a substantial negative correlation between the proportion of Immigrants from Northern Europe and median household income in the United States with a correlation coefficient (R) of -0.504 and weighted average of $99,813, a difference of 6.2%.
Median Household Income Correlation Summary
| Measurement | Argentinean | Immigrants from Northern Europe |
| Minimum | $49,375 | $24,028 |
| Maximum | $250,001 | $209,716 |
| Range | $200,626 | $185,688 |
| Mean | $107,782 | $107,993 |
| Median | $97,608 | $106,962 |
| Interquartile 25% (IQ1) | $76,750 | $73,842 |
| Interquartile 75% (IQ3) | $117,422 | $145,929 |
| Interquartile Range (IQR) | $40,672 | $72,086 |
| Standard Deviation (Sample) | $45,385 | $43,756 |
| Standard Deviation (Population) | $45,093 | $43,384 |
Similar Demographics by Median Household Income
Demographics Similar to Argentineans by Median Household Income
In terms of median household income, the demographic groups most similar to Argentineans are Mongolian ($93,971, a difference of 0.010%), Immigrants from Fiji ($93,933, a difference of 0.030%), Immigrants from Philippines ($93,899, a difference of 0.070%), Lithuanian ($93,852, a difference of 0.11%), and Immigrants from Scotland ($94,091, a difference of 0.14%).
| Demographics | Rating | Rank | Median Household Income |
| Immigrants | Norway | 99.8 /100 | #62 | Exceptional $94,846 |
| Greeks | 99.8 /100 | #63 | Exceptional $94,735 |
| Immigrants | Netherlands | 99.7 /100 | #64 | Exceptional $94,411 |
| Immigrants | Belarus | 99.7 /100 | #65 | Exceptional $94,399 |
| Immigrants | Romania | 99.7 /100 | #66 | Exceptional $94,222 |
| Immigrants | Scotland | 99.7 /100 | #67 | Exceptional $94,091 |
| Mongolians | 99.7 /100 | #68 | Exceptional $93,971 |
| Argentineans | 99.7 /100 | #69 | Exceptional $93,960 |
| Immigrants | Fiji | 99.7 /100 | #70 | Exceptional $93,933 |
| Immigrants | Philippines | 99.6 /100 | #71 | Exceptional $93,899 |
| Lithuanians | 99.6 /100 | #72 | Exceptional $93,852 |
| Immigrants | Egypt | 99.6 /100 | #73 | Exceptional $93,700 |
| Immigrants | Latvia | 99.6 /100 | #74 | Exceptional $93,602 |
| Immigrants | Italy | 99.5 /100 | #75 | Exceptional $93,465 |
| South Africans | 99.5 /100 | #76 | Exceptional $93,379 |
Demographics Similar to Immigrants from Northern Europe by Median Household Income
In terms of median household income, the demographic groups most similar to Immigrants from Northern Europe are Immigrants from Asia ($99,933, a difference of 0.12%), Immigrants from Sri Lanka ($99,943, a difference of 0.13%), Bhutanese ($100,151, a difference of 0.34%), Turkish ($99,389, a difference of 0.43%), and Immigrants from Belgium ($100,306, a difference of 0.49%).
| Demographics | Rating | Rank | Median Household Income |
| Immigrants | Bolivia | 100.0 /100 | #23 | Exceptional $101,394 |
| Immigrants | Japan | 100.0 /100 | #24 | Exceptional $100,711 |
| Immigrants | Sweden | 100.0 /100 | #25 | Exceptional $100,699 |
| Immigrants | Belgium | 100.0 /100 | #26 | Exceptional $100,306 |
| Bhutanese | 100.0 /100 | #27 | Exceptional $100,151 |
| Immigrants | Sri Lanka | 100.0 /100 | #28 | Exceptional $99,943 |
| Immigrants | Asia | 100.0 /100 | #29 | Exceptional $99,933 |
| Immigrants | Northern Europe | 100.0 /100 | #30 | Exceptional $99,813 |
| Turks | 100.0 /100 | #31 | Exceptional $99,389 |
| Immigrants | Denmark | 100.0 /100 | #32 | Exceptional $98,510 |
| Chinese | 100.0 /100 | #33 | Exceptional $98,496 |
| Russians | 100.0 /100 | #34 | Exceptional $98,008 |
| Immigrants | Switzerland | 100.0 /100 | #35 | Exceptional $97,979 |
| Immigrants | Pakistan | 100.0 /100 | #36 | Exceptional $97,528 |
| Latvians | 100.0 /100 | #37 | Exceptional $97,311 |