Argentinean vs Romanian Median Household Income
COMPARE
Argentinean
Romanian
Median Household Income
Median Household Income Comparison
Argentineans
Romanians
$93,960
MEDIAN HOUSEHOLD INCOME
99.7/ 100
METRIC RATING
69th/ 347
METRIC RANK
$91,994
MEDIAN HOUSEHOLD INCOME
98.8/ 100
METRIC RATING
89th/ 347
METRIC RANK
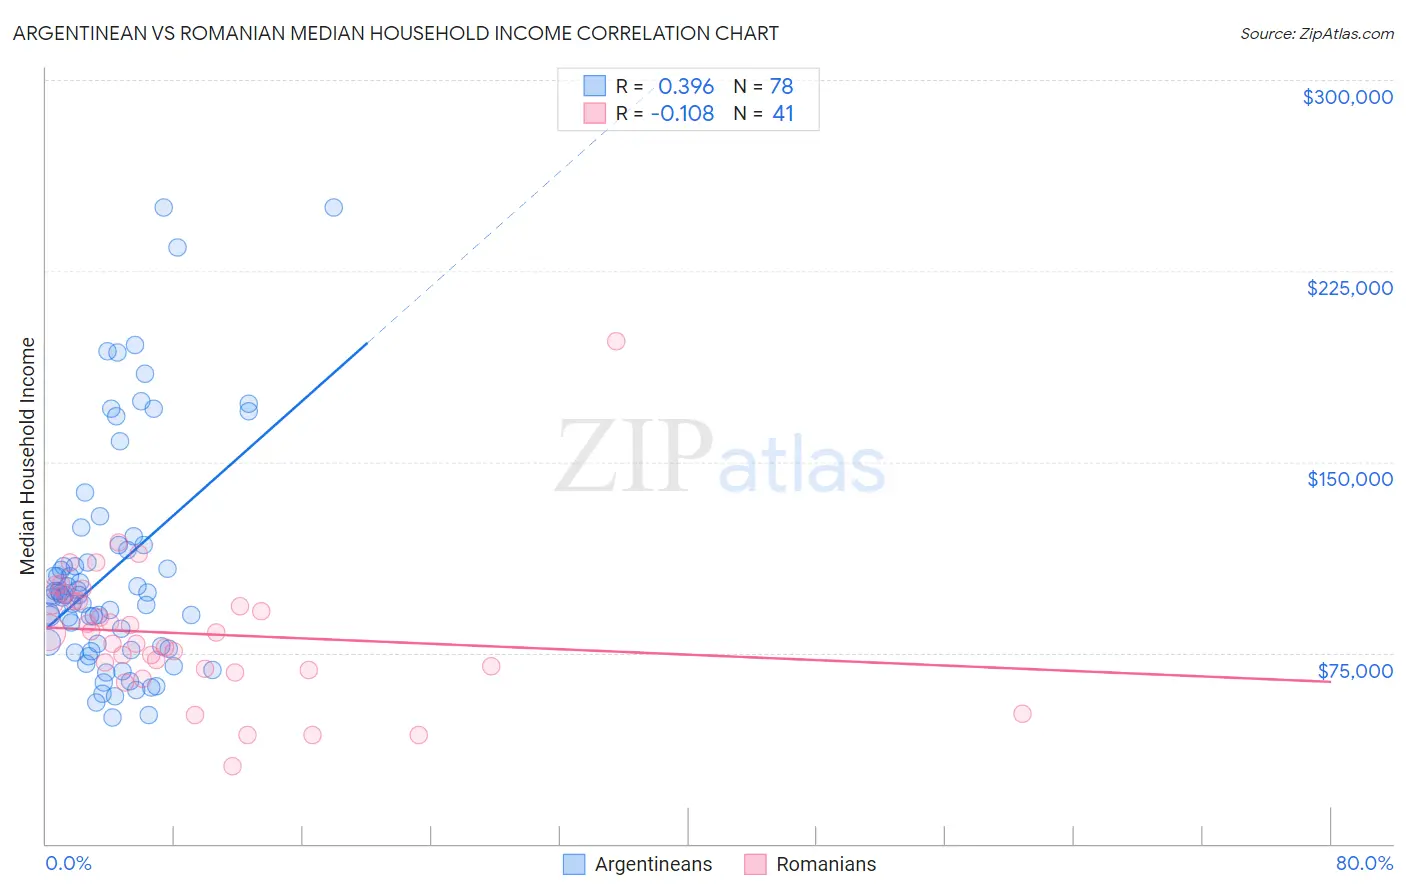
Argentinean vs Romanian Median Household Income Correlation Chart
The statistical analysis conducted on geographies consisting of 296,944,042 people shows a mild positive correlation between the proportion of Argentineans and median household income in the United States with a correlation coefficient (R) of 0.396 and weighted average of $93,960. Similarly, the statistical analysis conducted on geographies consisting of 377,637,037 people shows a poor negative correlation between the proportion of Romanians and median household income in the United States with a correlation coefficient (R) of -0.108 and weighted average of $91,994, a difference of 2.1%.
Median Household Income Correlation Summary
| Measurement | Argentinean | Romanian |
| Minimum | $49,375 | $30,320 |
| Maximum | $250,001 | $197,500 |
| Range | $200,626 | $167,180 |
| Mean | $107,782 | $82,526 |
| Median | $97,608 | $82,785 |
| Interquartile 25% (IQ1) | $76,750 | $68,581 |
| Interquartile 75% (IQ3) | $117,422 | $95,353 |
| Interquartile Range (IQR) | $40,672 | $26,772 |
| Standard Deviation (Sample) | $45,385 | $27,672 |
| Standard Deviation (Population) | $45,093 | $27,332 |
Demographics Similar to Argentineans and Romanians by Median Household Income
In terms of median household income, the demographic groups most similar to Argentineans are Immigrants from Fiji ($93,933, a difference of 0.030%), Immigrants from Philippines ($93,899, a difference of 0.070%), Lithuanian ($93,852, a difference of 0.11%), Immigrants from Egypt ($93,700, a difference of 0.28%), and Immigrants from Latvia ($93,602, a difference of 0.38%). Similarly, the demographic groups most similar to Romanians are Immigrants from Canada ($92,029, a difference of 0.040%), Immigrants from England ($92,098, a difference of 0.11%), Immigrants from Hungary ($92,094, a difference of 0.11%), Immigrants from Croatia ($92,225, a difference of 0.25%), and Immigrants from Argentina ($92,417, a difference of 0.46%).
| Demographics | Rating | Rank | Median Household Income |
| Argentineans | 99.7 /100 | #69 | Exceptional $93,960 |
| Immigrants | Fiji | 99.7 /100 | #70 | Exceptional $93,933 |
| Immigrants | Philippines | 99.6 /100 | #71 | Exceptional $93,899 |
| Lithuanians | 99.6 /100 | #72 | Exceptional $93,852 |
| Immigrants | Egypt | 99.6 /100 | #73 | Exceptional $93,700 |
| Immigrants | Latvia | 99.6 /100 | #74 | Exceptional $93,602 |
| Immigrants | Italy | 99.5 /100 | #75 | Exceptional $93,465 |
| South Africans | 99.5 /100 | #76 | Exceptional $93,379 |
| Immigrants | Afghanistan | 99.5 /100 | #77 | Exceptional $93,375 |
| Immigrants | Bulgaria | 99.4 /100 | #78 | Exceptional $93,148 |
| Sri Lankans | 99.4 /100 | #79 | Exceptional $93,093 |
| Tongans | 99.4 /100 | #80 | Exceptional $93,076 |
| Immigrants | Eastern Europe | 99.4 /100 | #81 | Exceptional $93,051 |
| Immigrants | Spain | 99.3 /100 | #82 | Exceptional $92,732 |
| Italians | 99.1 /100 | #83 | Exceptional $92,475 |
| Immigrants | Argentina | 99.1 /100 | #84 | Exceptional $92,417 |
| Immigrants | Croatia | 99.0 /100 | #85 | Exceptional $92,225 |
| Immigrants | England | 98.9 /100 | #86 | Exceptional $92,098 |
| Immigrants | Hungary | 98.9 /100 | #87 | Exceptional $92,094 |
| Immigrants | Canada | 98.8 /100 | #88 | Exceptional $92,029 |
| Romanians | 98.8 /100 | #89 | Exceptional $91,994 |