Argentinean vs Basque Median Household Income
COMPARE
Argentinean
Basque
Median Household Income
Median Household Income Comparison
Argentineans
Basques
$93,960
MEDIAN HOUSEHOLD INCOME
99.7/ 100
METRIC RATING
69th/ 347
METRIC RANK
$87,001
MEDIAN HOUSEHOLD INCOME
77.2/ 100
METRIC RATING
150th/ 347
METRIC RANK
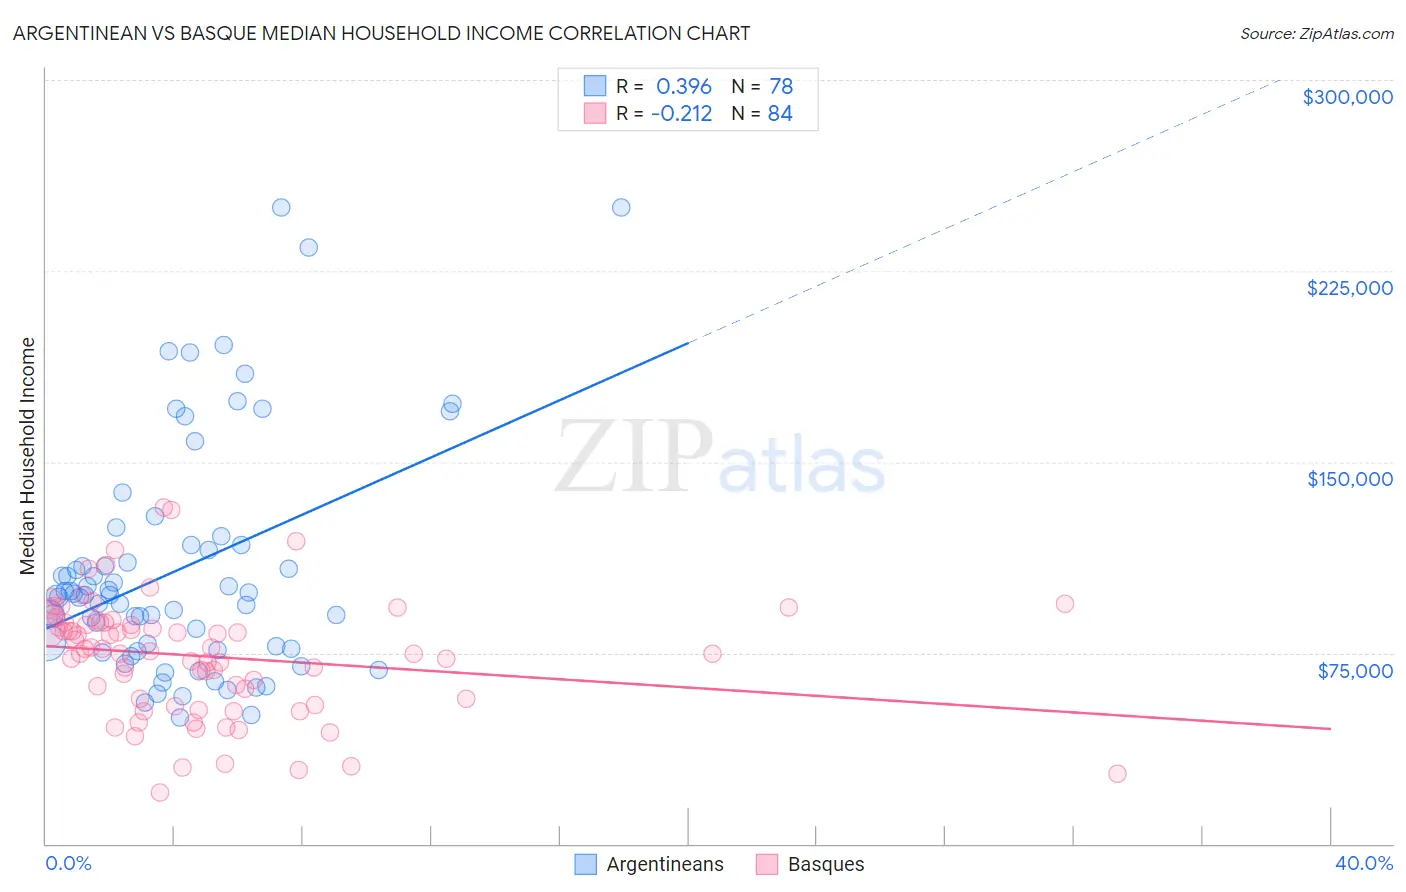
Argentinean vs Basque Median Household Income Correlation Chart
The statistical analysis conducted on geographies consisting of 296,944,042 people shows a mild positive correlation between the proportion of Argentineans and median household income in the United States with a correlation coefficient (R) of 0.396 and weighted average of $93,960. Similarly, the statistical analysis conducted on geographies consisting of 165,746,357 people shows a weak negative correlation between the proportion of Basques and median household income in the United States with a correlation coefficient (R) of -0.212 and weighted average of $87,001, a difference of 8.0%.
Median Household Income Correlation Summary
| Measurement | Argentinean | Basque |
| Minimum | $49,375 | $20,139 |
| Maximum | $250,001 | $131,838 |
| Range | $200,626 | $111,699 |
| Mean | $107,782 | $73,627 |
| Median | $97,608 | $76,033 |
| Interquartile 25% (IQ1) | $76,750 | $57,079 |
| Interquartile 75% (IQ3) | $117,422 | $86,843 |
| Interquartile Range (IQR) | $40,672 | $29,764 |
| Standard Deviation (Sample) | $45,385 | $22,838 |
| Standard Deviation (Population) | $45,093 | $22,701 |
Similar Demographics by Median Household Income
Demographics Similar to Argentineans by Median Household Income
In terms of median household income, the demographic groups most similar to Argentineans are Mongolian ($93,971, a difference of 0.010%), Immigrants from Fiji ($93,933, a difference of 0.030%), Immigrants from Philippines ($93,899, a difference of 0.070%), Lithuanian ($93,852, a difference of 0.11%), and Immigrants from Scotland ($94,091, a difference of 0.14%).
| Demographics | Rating | Rank | Median Household Income |
| Immigrants | Norway | 99.8 /100 | #62 | Exceptional $94,846 |
| Greeks | 99.8 /100 | #63 | Exceptional $94,735 |
| Immigrants | Netherlands | 99.7 /100 | #64 | Exceptional $94,411 |
| Immigrants | Belarus | 99.7 /100 | #65 | Exceptional $94,399 |
| Immigrants | Romania | 99.7 /100 | #66 | Exceptional $94,222 |
| Immigrants | Scotland | 99.7 /100 | #67 | Exceptional $94,091 |
| Mongolians | 99.7 /100 | #68 | Exceptional $93,971 |
| Argentineans | 99.7 /100 | #69 | Exceptional $93,960 |
| Immigrants | Fiji | 99.7 /100 | #70 | Exceptional $93,933 |
| Immigrants | Philippines | 99.6 /100 | #71 | Exceptional $93,899 |
| Lithuanians | 99.6 /100 | #72 | Exceptional $93,852 |
| Immigrants | Egypt | 99.6 /100 | #73 | Exceptional $93,700 |
| Immigrants | Latvia | 99.6 /100 | #74 | Exceptional $93,602 |
| Immigrants | Italy | 99.5 /100 | #75 | Exceptional $93,465 |
| South Africans | 99.5 /100 | #76 | Exceptional $93,379 |
Demographics Similar to Basques by Median Household Income
In terms of median household income, the demographic groups most similar to Basques are Immigrants from Nepal ($87,046, a difference of 0.050%), Hungarian ($86,920, a difference of 0.090%), Immigrants from Saudi Arabia ($86,875, a difference of 0.15%), South American ($86,824, a difference of 0.20%), and Immigrants from Germany ($86,764, a difference of 0.27%).
| Demographics | Rating | Rank | Median Household Income |
| Danes | 83.9 /100 | #143 | Excellent $87,676 |
| Serbians | 83.0 /100 | #144 | Excellent $87,572 |
| Ugandans | 82.9 /100 | #145 | Excellent $87,557 |
| Immigrants | Uganda | 82.8 /100 | #146 | Excellent $87,553 |
| South American Indians | 81.8 /100 | #147 | Excellent $87,446 |
| Costa Ricans | 80.0 /100 | #148 | Excellent $87,262 |
| Immigrants | Nepal | 77.7 /100 | #149 | Good $87,046 |
| Basques | 77.2 /100 | #150 | Good $87,001 |
| Hungarians | 76.3 /100 | #151 | Good $86,920 |
| Immigrants | Saudi Arabia | 75.8 /100 | #152 | Good $86,875 |
| South Americans | 75.1 /100 | #153 | Good $86,824 |
| Immigrants | Germany | 74.4 /100 | #154 | Good $86,764 |
| Carpatho Rusyns | 72.8 /100 | #155 | Good $86,635 |
| Immigrants | Albania | 71.5 /100 | #156 | Good $86,534 |
| Samoans | 71.0 /100 | #157 | Good $86,498 |